
Figure 3.
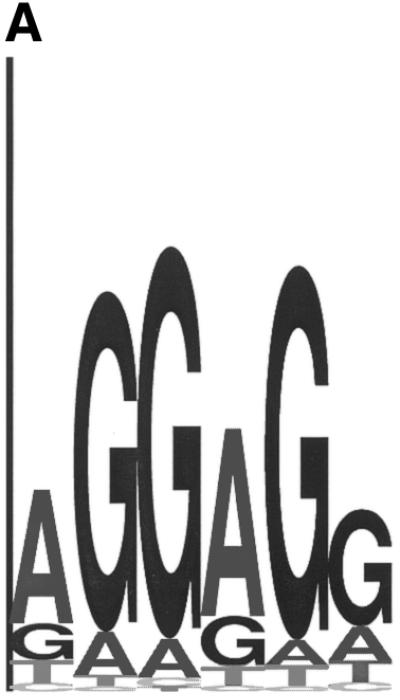

(A) Sequence logo representing the RBS positional frequency pattern detected by GeneMarkS in the analysis of B.subtilis genomic data. The total height of the four letters in each position indicates the position specific information content, while the height of each letter is proportional to the nucleotide frequency (42). (B) Graph of probability distribution of spacer length, the sequence between the RBS sequence and the gene start.