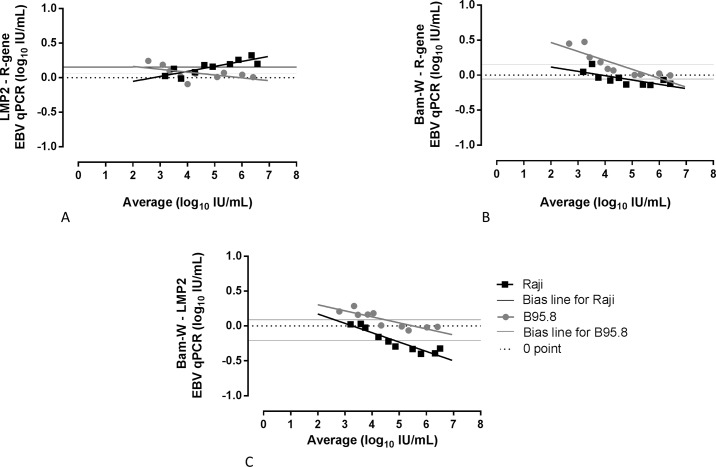
Fig 4. Bland-Altman bias plots for three different quantitative EBV DNA real-time PCR assays.
Ten serial dilutions of Raji and B95.8 cell line supernatants were tested for EBV DNA quantification by LMP2 and EBV R-gene qPCRs (A). The same samples were tested by Bam-W qPCR compared with R-gene (B) and LMP2 qPCRs (C).

