
Figure 1. Figure showing the history of present illness and treatment.
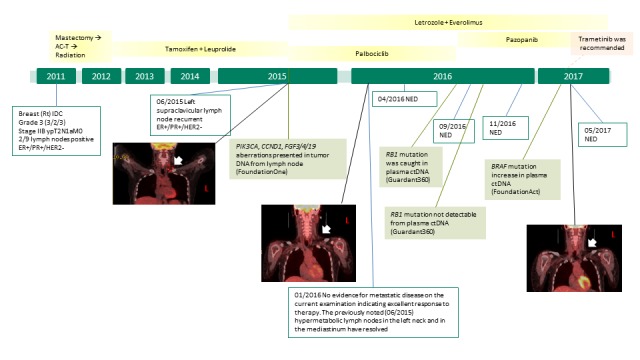
The disease progression and treatment history is presented in this figure. The positron emission tomography–computed tomography (PET/CT) images are showing the recurrent disease in 2015 and clear scans from 2016. Treatment regimens are presented in the yellow boxes and significant genomic findings are in light green boxes.