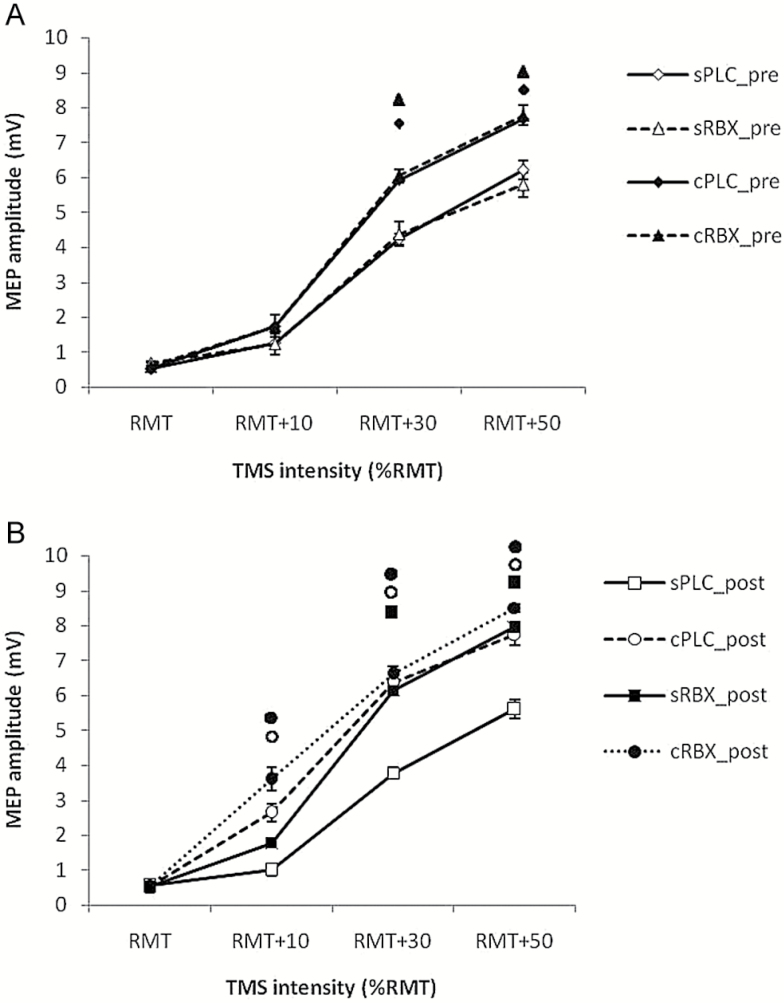
Figure 2.
Input-output curve values before and after drug administration. A and B display the MEP amplitudes (means±SEM) at 100%, 110%, 130%, and 150% of resting motor threshold (RMT) under 4 conditions: single-dose placebo (sPLC), single-dose reboxetine (sRBX), chronic reboxetine + placebo medication at the day of experiment (cPLC), and chronic reboxetine + reboxetine at the day of experiment (cRBX). (A) cPLC pre and cRBX pre showed significantly larger MEP amplitudes compared with sPLC pre elicited by 130% and 150% RMT TMS. (B) sRBX post showed significantly larger MEP amplitudes compared with sPLC post at 130% and 150% RMT TMS. cPLC post and cRBX post significantly enhanced the MEP amplitude compared with sPLC post at 110%, 130%, and 150% RMT TMS. Floating symbols (♦ : cPLC pre; ▲: cRBX pre; ◼: sRBX post; ○: cPLC post; ●:cRBX post) indicate a significant difference between respective conditions and single placebo condition at the same TMS intensity (Student’s t test, 2-tailed, paired samples, P<.05). Vertical bars depict SEM.

