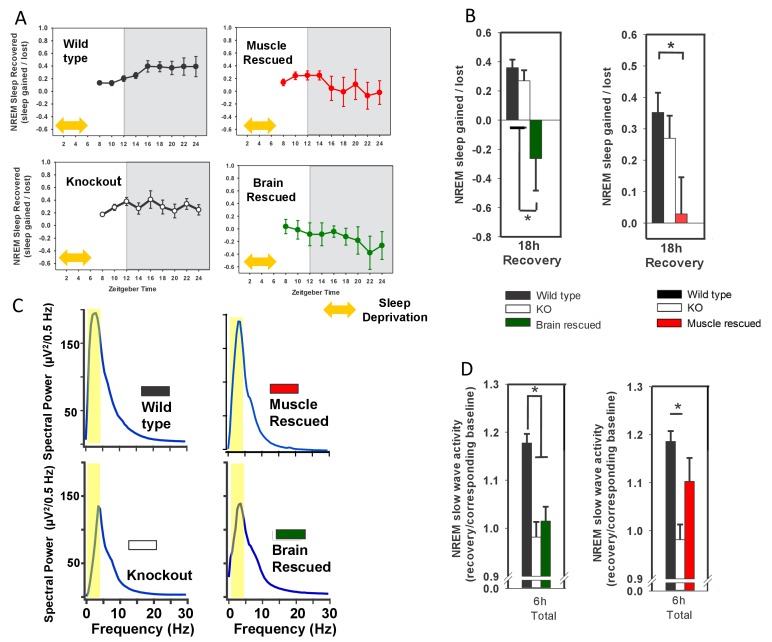
Figure 2. Rescuing Bmal1 in skeletal muscle or brain reduces the amount of NREM sleep recovered after forced wakefulness.
Continuous sleep recordings during 18 hr of recovery sleep were obtained from the mice in Figure 1 after 6 hr of forced wakefulness (A; yellow double arrow = forced wakefulness). The total NREM recovery sleep during this 18 hr period in brain-rescued and muscle-rescued mice was reduced when compared to WT mice (B, ANOVA brain rescued, F(2,28)=6.47, p=0.005, p=0.004 Tukey’s; ANOVA muscle rescued, F(2,30)=5.45, p=0.01 Tukey’s). Values in A and B represent sleep time gained after forced wakefulness (calculated using the corresponding interval during undisturbed sleep) as a percentage of total sleep lost (mean ± s.e.m.). The distribution of EEG power during NREM sleep for representative animals from each genotype is shown in (panel C). Slow wave activity (highlighted area) represents power in the 0.5 to 4 Hz frequency band. NREM slow wave activity was reduced in knockout mice following forced wakefulness—compared to WT mice (D, % change over corresponding baseline; p<0.01, Tukey’s test). This reduction in slow wave activity was absent when Bmal1 was rescued in the skeletal muscle (D). Knockout animals in B and D are replicated between graphs to aid in comparison. *p<0.05.


