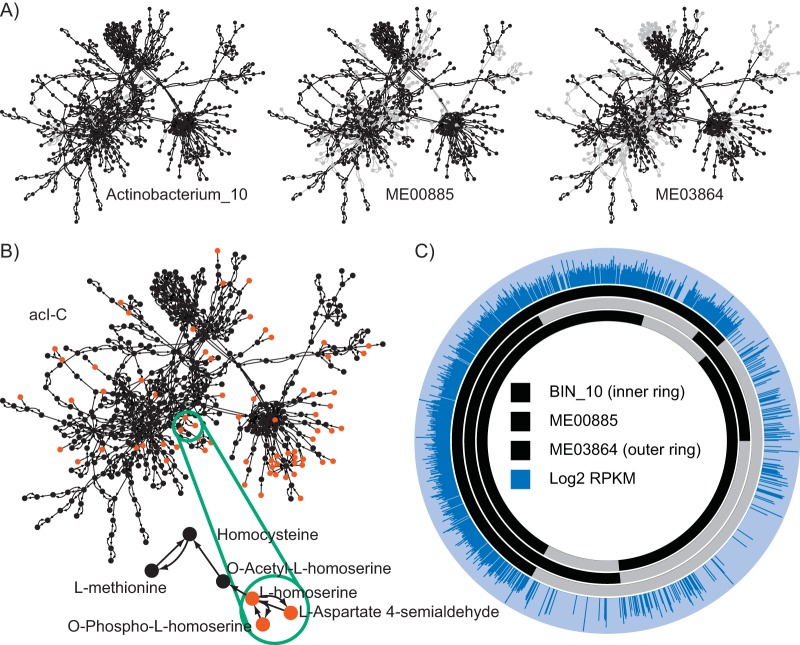
FIG 2 .
Overview of the seed set framework and metatranscriptomic mapping, using three genomes from the acI-C clade as an example. (A) Metabolic network graphs were created for each genome belonging to clade acI-C. In these graphs, metabolites are represented as nodes (circles) and reactions by arcs (arrows). Gray nodes and edges indicate components of the composite graph missing from that genome graph. Additional information on this step of the workflow is available in Fig. S2. (B) A composite network graph was created for each clade by joining graphs representing all genomes from that clade, and seed compounds (red) were computed for the composite graph. Additional information on this step of the workflow is available in Fig. S3, Fig. S4, and Fig. S5. (Inset) Three seed compounds which indicate an auxotrophy for l-homoserine, a methionine precursor. (C) Metatranscriptomic reads were mapped to each individual genome using BBMap. Orthologous gene clusters were identified using OrthoMCL (30). For each cluster, unique reads which map to any gene within that cluster were counted using HTSeq (48). The relative levels of gene expression were computed using RPKM (49).

