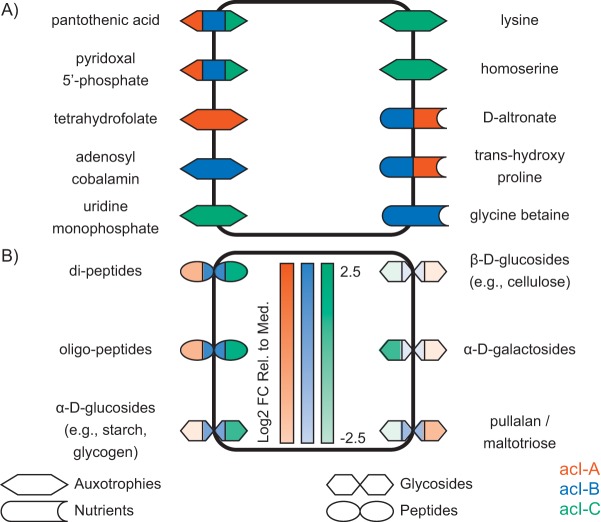
FIG 3 .
Seed compounds of members of the acI lineage. (A) Auxotrophies and nutrient sources, not including peptides and glycosides. (B) Peptides and glycosides. These compounds represent those inferred from genome annotations rather than the seed compounds. In panel B, the intensity of the color indicates the log2 fold change relative to the median (FC Rel. to Med.) of the encoding gene cluster. For compounds acted upon by multiple gene clusters, the percentile of the most highly expressed cluster was chosen.

