FIG 5 .
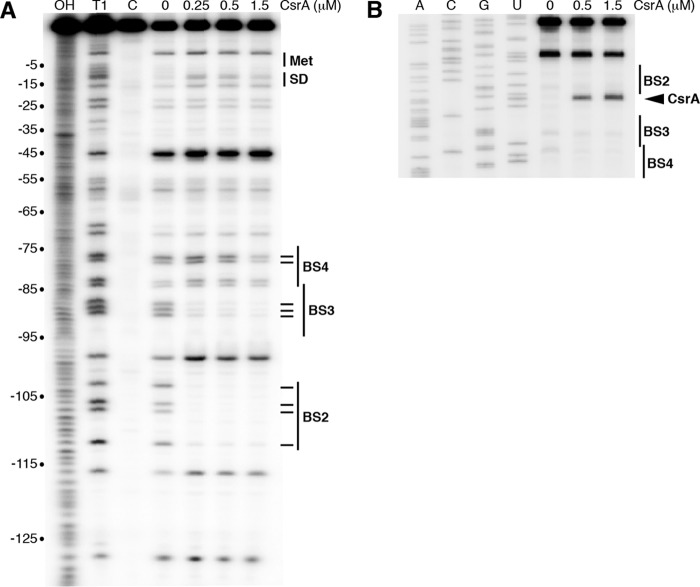
CsrA-iraD RNA footprint and toeprint analyses. (A) CsrA-iraD RNA footprint. Labeled iraD RNA was treated with RNase T1 in the presence of the CsrA concentration shown at the top of the lane. Partial alkaline hydrolysis (OH) and RNase T1 digestion (T1) ladders, as well as a control lane without RNase T1 treatment (C), are marked. Positions of BS2, BS3, BS4, the iraD start codon (Met), and the Shine-Dalgarno (SD) sequence are shown. Residues that were protected by bound CsrA from RNase T1 cleavage are marked (–). Numbering is with respect to the start of iraD translation. (B) CsrA-iraD RNA toeprint. The concentration of CsrA used is shown at the top of the lane. Positions of BS2, BS3, BS4, and the CsrA toeprint (carat) are marked. Lanes corresponding to results of sequencing to reveal A, C, G, and U residues are labeled.

