FIG 7 .
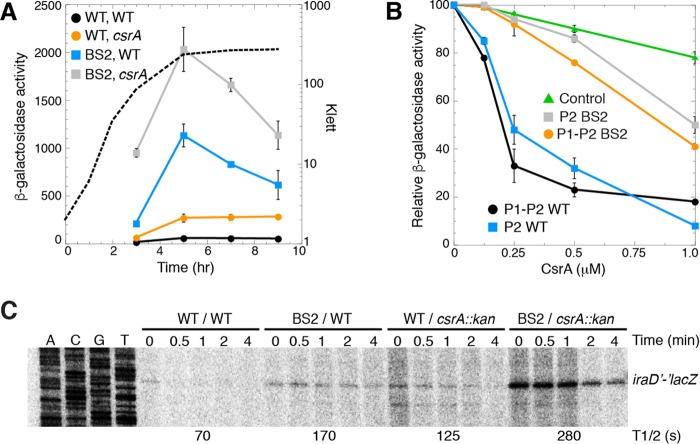
Effects of csrA::kan and BS2 mutations on iraD expression. (A) β-Galactosidase activities (Miller units) ± standard deviations of P1-P2-iraD'-'lacZ translational fusions were determined throughout growth. Experiments were performed at least three times. A representative growth curve is shown with a dashed line (Klett). Symbols: black, WT fusion WT csrA strain; orange, WT fusion csrA::kan strain; blue, BS2 mutant fusion WT csrA strain; gray, BS2 mutant fusion csrA::kan strain. (B) β-Galactosidase activities ± standard deviations of P1-P2-iraD'-'lacZ and P2-iraD'-'lacZ translational fusions in the presence of the indicated CsrA concentration were determined usinjg a PURExpress system. Experiments were performed at least three times. Values for samples without CsrA were set to 100. Symbols: black, WT P1-P2-iraD'-'lacZ fusion; orange, BS2 mutant P1-P2-iraD'-'lacZ fusion; blue, WT P2-iraD'-'lacZ fusion; gray, BS2 mutant P2-iraD'-'lacZ fusion; green, control pnp'-'lacZ translational fusion that is not repressed by CsrA (19). (C) Cultures were grown to mid-exponential phase prior to the addition of rifampin. Samples were harvested at the indicated times and then analyzed by primer extension for iraD'-'lacZ mRNA levels. mRNA half-lives (T1/2) are shown at the bottom of the gel. This experiment was performed twice.

