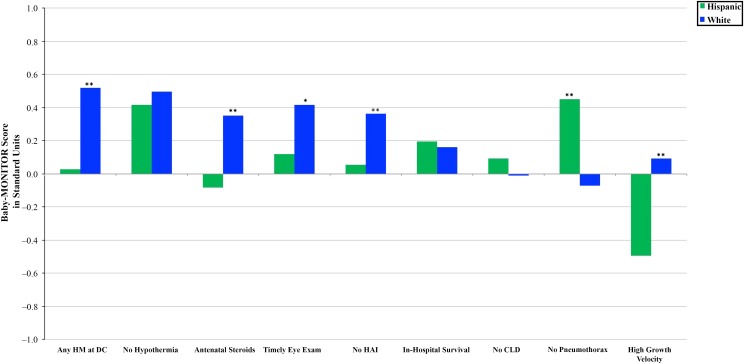
FIGURE 4.
Baby-MONITOR subcomponent score by race and/or ethnicity. Each subcomponent is listed on the x-axis; standardized observed minus expected z scores are shown on the y-axis. Comparison of Hispanic and white infants. CLD, chronic lung disease; DC, discharge; HAI, health care–associated infection; HM, human milk. ** P < .05, * P < .1.

