
Figure 2.
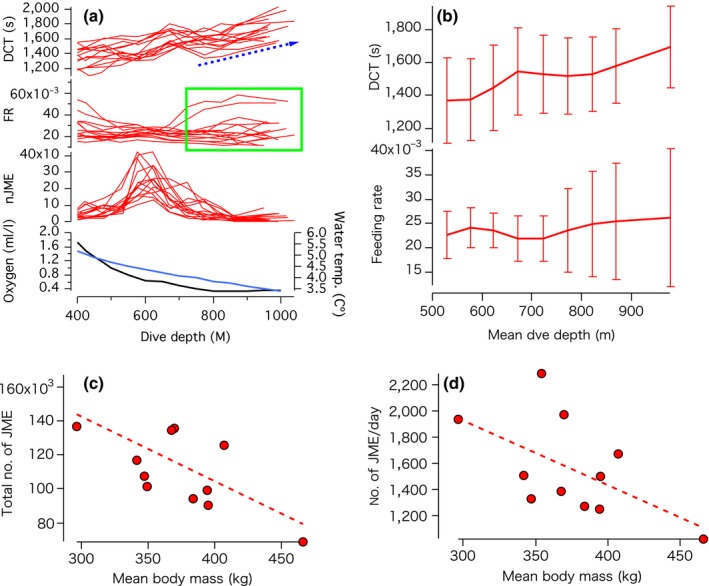
(a) Relationship between dive depth and mean dive cycle time (DCT) (upper), mean feeding rate (FR, which was calculated as nJME/DCT) (upper middle), total number of jaw motion events (JME) (lower middle), and dissolved oxygen concentration (black line) and temperature (blue line) (bottom). Mean DCT and mean FR were calculated for each of 14 seals (shown in different lines) for every 50‐m depth range for the dives with the maximum depth between 400 m and 1100 m (400 m = 400–450 m, 450 m = 450–500 m, etc.). The blue arrow indicates the general trends in DCT in the >800 m depth zone. The green box indicates the irregular zone of FR, where a minimum level is maintained despite the increased DCT. Dissolved oxygen concentration reached the minimum level at 800 m depth (dissolved oxygen and water temperature data: NOAA World Ocean Data Center, representing average profiles at one‐degree‐square at 44.5°N, 130°E). (b) Changes in the mean DCT (upper) and mean feeding rates (lower) in relation to dive depths. Mean values for 14 seals are shown with standard deviations. (c,d) Relationship between the total number of JME during migration and body mass (c) and relationship between nJME/day and body mass (d). Body mass represents mean body mass between body mass at the start and the end of migration. Dashed lines show the regression line of models supported with ΔAICc value <2. Statistical details are shown in Table 2