Figure 3.

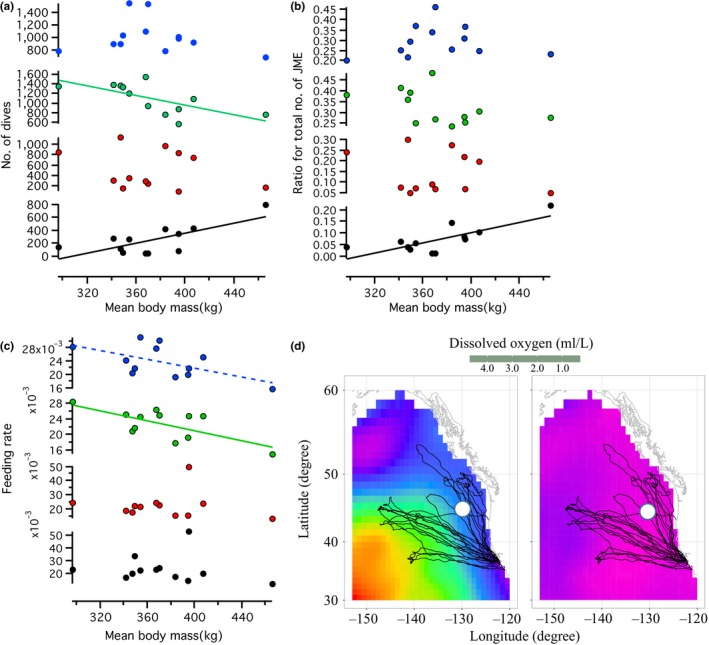
(a–c) Relationship between mean body mass and number of dives (a), nJME ratio for total nJME (b) and feeding rate (FR) (c) at different depth zones. Blue dots, green dots, red dots, and black dots represent 500 m, 600 m, 700 m, and over 800 m depth zones, respectively (averaged data for 500–600, 600–700, 700–800, >800 m depth ranges). Regression lines are shown for the models supported statistically (solid and dashed lines: models supported with ΔAICc > 2 and <2, respectively). Statistical details are shown in Table 2. (d) Averaged dissolved oxygen concentration (ml/L) in spring season in one‐degree‐square resolution at 400 m depth (left) and 800 m depth (right) in the Northeast Pacific (Data: NOAA World Ocean Data Center, averaged with values collected from 1955 to 2012, as described below, http://data.nodc.noaa.gov/woa/ WOA13/DOC/woa13v2). An oxygen minimum zone at 800 m depth prevailed over most of the postbreeding migration region of the seals. The white mark represents the location of video records
