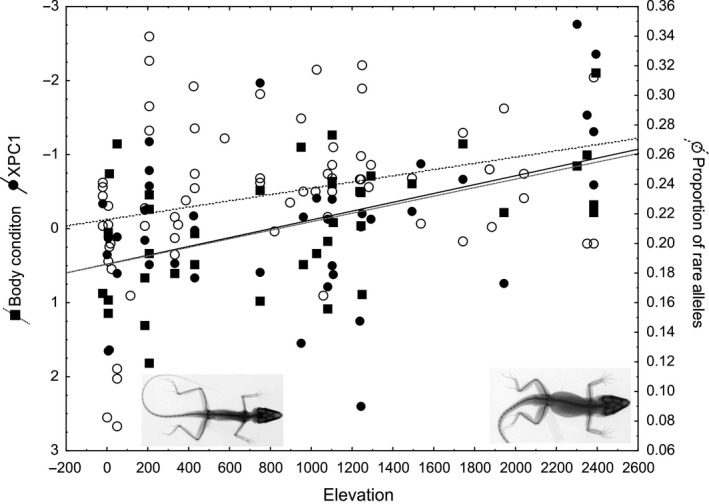
Figure 3.

Covariation of rare allele frequencies with phenotypic adaptation to elevation. Phenotypic variables shown are published in Wollenberg et al., 2013 and represent Body condition (SVL/weight in g), and XPC1 (relative bone length, variable shows shorter bones as larger values). Inset images show X‐rays of typical lowland phenotypes of Anolis cybotes (left), and highland A. cybotes (right, own images)
