
Fig. 2.
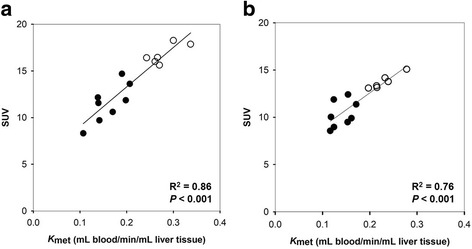
Correlations between regional values of SUV and K met (a) and between whole-liver values of SUV and K met (b) for 18F-FDGal PET/CT in patients with cirrhosis (black circle) and healthy subjects (white circle). Results from reconstruction algorithm with resolution modelling and a 168 matrix are shown with fitted linear regression lines