
. 2017 Aug 29;7:30. doi: 10.1186/s13561-017-0166-2
© The Author(s). 2017
Open AccessThis article is distributed under the terms of the Creative Commons Attribution 4.0 International License (http://creativecommons.org/licenses/by/4.0/), which permits unrestricted use, distribution, and reproduction in any medium, provided you give appropriate credit to the original author(s) and the source, provide a link to the Creative Commons license, and indicate if changes were made.
Fig. 2.
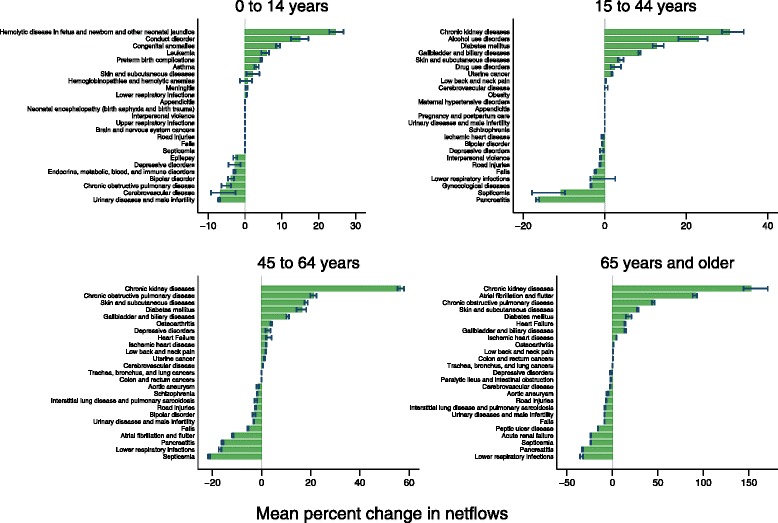
Mean percent change in netflows for top 25 causes by spending and age category