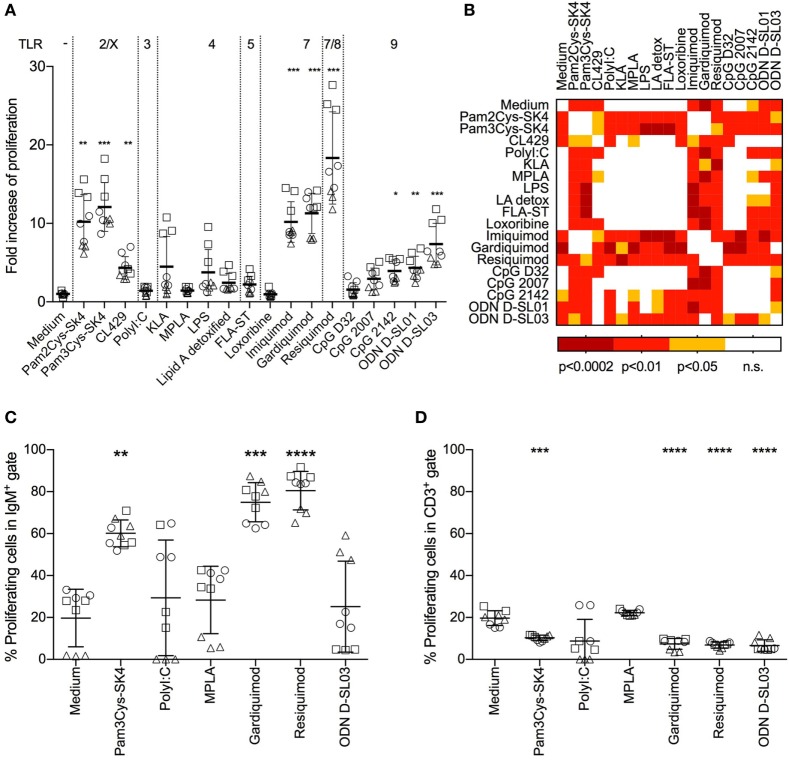
Figure 1.
Proliferative response of B cells in whole peripheral blood mononuclear cells (PBMCs) after stimulation with toll-like receptor ligands. (A) Proliferation of PBMCs after stimulation for 3 days was determined using a 3H-thymidine assay. The fold increase over the medium control is shown. (B) Heatmap giving an overview of the statistical significances found between the treatments shown in (A). (C) Proliferation of IgM+ B cells determined by flow cytometry using CellTraceViolet. The percentage of proliferating cells in the IgM gate is shown. (D) Proliferating CD3+ T cells, again determined using CellTrace Violet. The percentage of proliferating cells in the CD3 gate is shown. (A,C,D) PBMC culture triplicates from three different animals, each depicted by a different shape. Mean values are indicated by horizontal bars. Error bars show SDs. Statistical significance was calculated using ANOVA followed by Tukey’s test (****P < 0.0001; ***P < 0.001; **P < 0.01; *P < 0.05; n.s., not significant).

