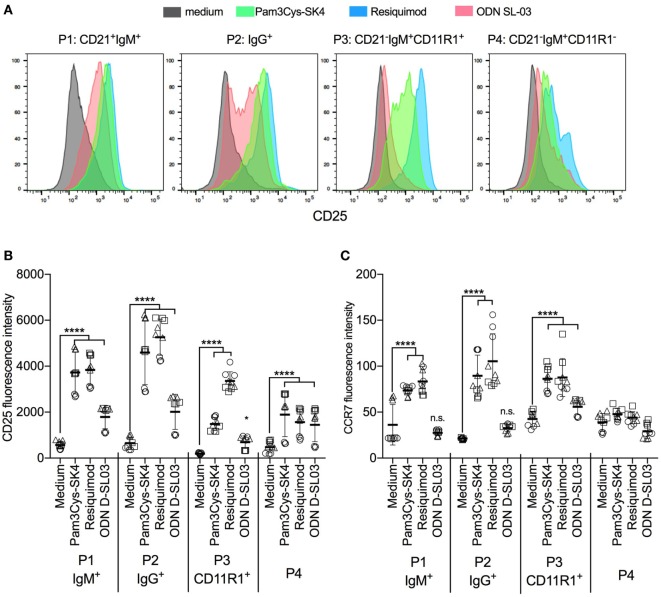
Figure 3.
Activation markers on B cell subsets after stimulation with toll-like receptor (TLR) ligands. (A) Histogram overlays of CD25 expression on the B cell subsets P1–P4 defined as shown in Figure 2. Peripheral blood mononuclear cells (PBMCs) were cultured and stimulated overnight and B-cell subset identified using multicolor flow cytometry. A representative animal out of three is shown. (B,C) Fluorescence intensity of CD25 and CCR7 after stimulation of PBMC with TLR ligands. PBMCs were stimulated overnight and B-cell subsets identified using multicolor flow cytometry. Triplicates cultures from three different animals, each depicted by a different symbol, are shown. Mean values are indicated by horizontal bars. Error bars show SDs. Statistical significance was calculated using ANOVA followed by Tukey’s test.

