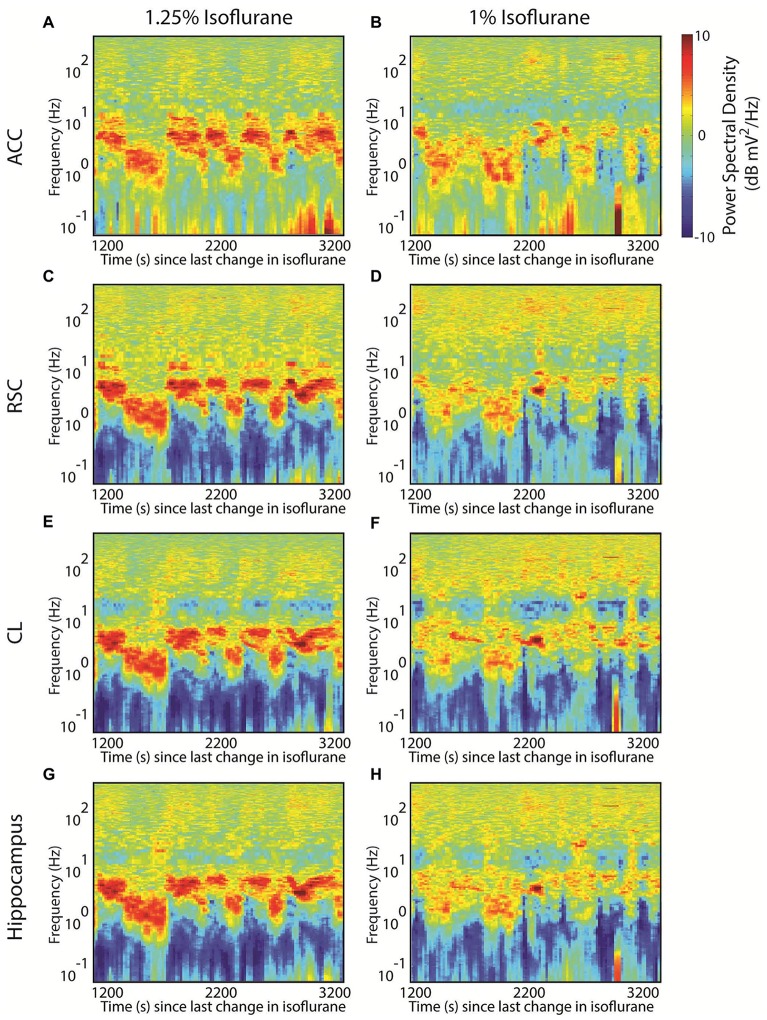
Figure 3.
Evidence for multistability during isoflurane anesthesia in the rat. (A) The spectrogram from an local field potential (LFP) recorded in deep anterior cingulate cortex of a rat breathing 1.25% isoflurane. Deviations from the overall mean power spectrum for that animal are indicated as decibel differences according to the color scale. Plotted data begin 20 min after isoflurane was decreased from 1.5% to 1.25%, and the duration of the plot is 2000 s. Note the frequent alternation between power spectra dominated by peaks at ~6 Hz and ~2 Hz. (B) Data from anterior cingulate, beginning 20 min after the isoflurane was decreased from 1.25% to 1% isoflurane. Here short lived examples of both the ~6 Hz and ~2 Hz peaks exist, but there are instances of more high frequency power (above 100 Hz), especially later in the recording. (C,D) The corresponding spectrograms from simultaneously recorded retrosplenial cortex; (E,F) from central lateral nucleus of the thalamus; (G,H) and from hippocampus.

