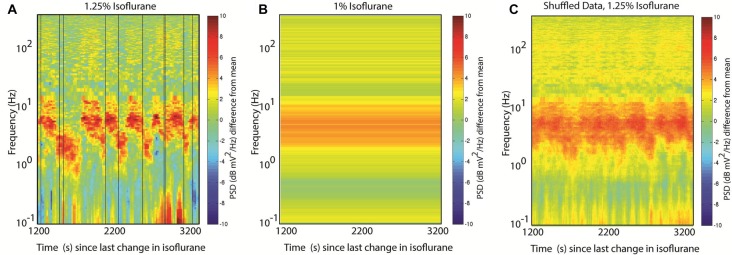
Figure 5.
Spectral analysis challenges with metastability. (A) Randomly chosen analysis times. The same time-frequency data shown in Figure 3A. Vertical black lines indicate 10 randomly chosen times during the acquired interval. (B) Welch’s method fails with nonstationary inputs: the power spectrum estimate obtained by averaging the 30 s of data on either side of each of the random times shown in (A). Compared with (A), the two peaks at 6 Hz and 2 Hz are blended into a single wide peak. (C) Averaging spectrograms across animals with similar brain dynamics will again abolish dynamical features. Here the same random time points from (A) are used to create surrogate spectrograms by using the time to start the data acquisition and wrap around to the start of the spectrogram once the end is reached; the 10 resulting spectrograms are then averaged together, abolishing most of the alternating features.

