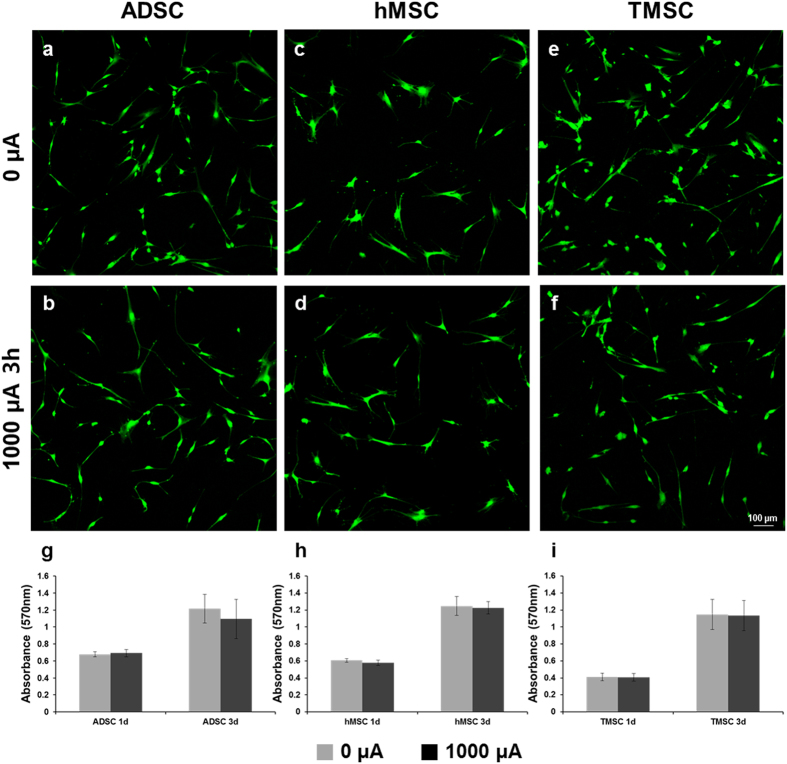
Figure 3.
The effect of direct electric current on the cell viability. The LIVE/DEAD assay images of (a) ADSC under 0 µA, (b) ADSC under 1000 µA for 3 h, (c) hMSC under 0 µA, (d) hMSC under 1000 µA for 3 h, (e) TMSC under 0 µA, (f) TMSC under 1000 µA for 3 h (live cells: green, Calcein AM/dead cells: red, EthD-1). Scale bar = 100 μm. The MTT assay of (g) ADSC, (h) hMSC, (i) TMSC for 1, 3d culture after 0 or 1000 µA treatment for 3 h.

