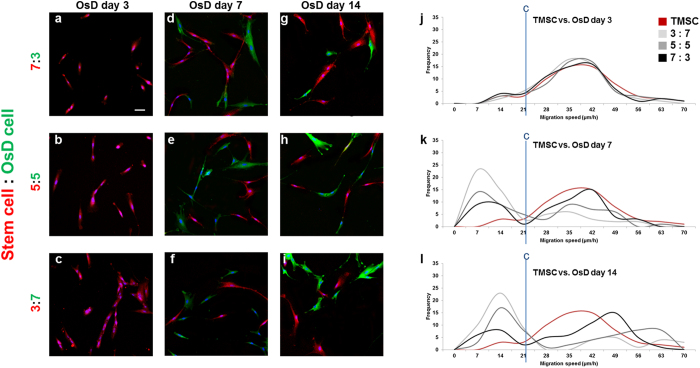
Figure 6.
Mixture of TMSC and osteogenic differentiated cells at different OsD days. The immunofluorescence images of TMSC and osteogenic differentiated cells mixture ratio of (a) 7:3, (b) 5:5, (c) 3:7 at day 3, (d) 7:3, (e) 5:5, (f) 3:7 at day 7, and (g) 7:3, (h) 5:5, (i) 3:7 at day 14. The histogram of TMSC and osteogenic differentiated cell mixture using electrotaxis analysis and Youden index under 1000 µA at (g) day 3, (h) day 7, (i) day 14. Cut point of TMSC vs. osteogenic differentiated cells was 22.42 μm/h. Scale bar = 100 μm.

