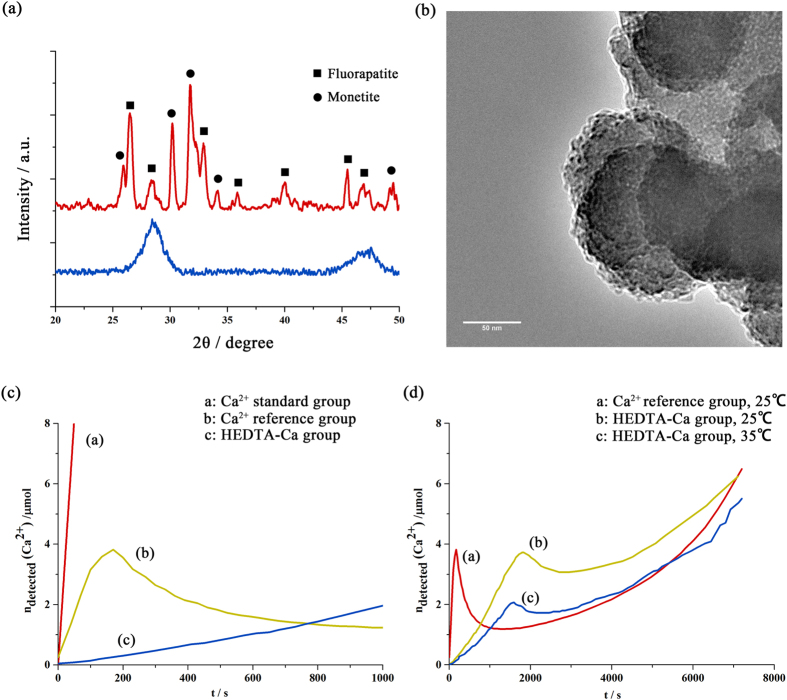
Figure 5.
Effects of HEDTA and temperature on the nucleation and growth of fluorapatite (a) shown in the XRD patterns of precipitates from the HEDTA solution (blue line) and the non-HEDTA group (yellow line). (b) TEM of the precipitate from the HEDTA solution, which showed PNCs of approximately 5 nm aggregating around ACP. (c,d) Time course of the amount of free calcium ions measured by a calcium ion-selective electrode (Ca-ISE) in different phosphate solutions at different temperatures.

