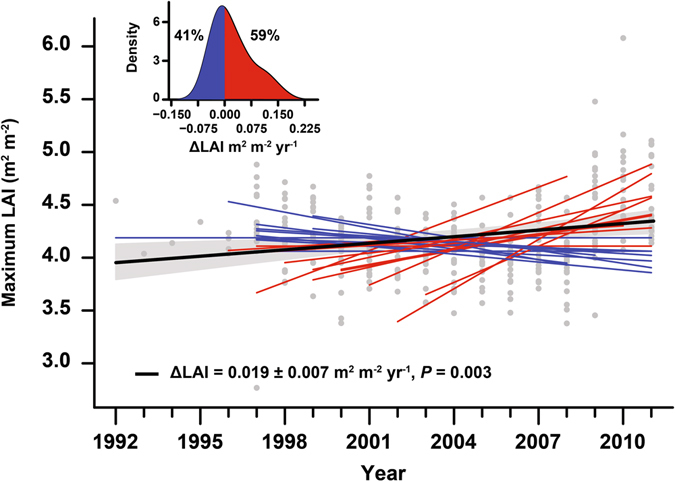
Figure 2.

Trends in forest maximum LAI. Red and blue lines indicate forests with increasing and decreasing trends, respectively, and the thick black line indicates the average trend. The shaded area indicates the standard error of the average trend. Grey dots indicate forest-year observations, and all values were adjusted to the same mean to remove forest-specific variability. The inset shows the modelled distribution of the trends using kernel-density estimation.
