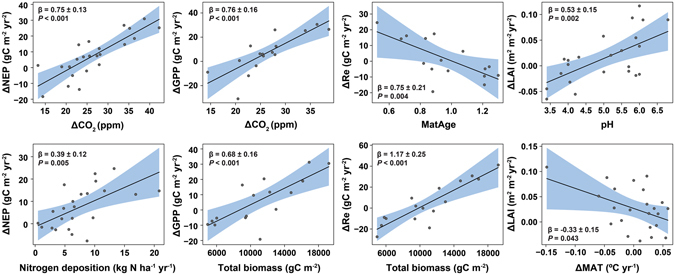
Figure 4.

Partial residual plots showing significant relationships found between predictors and C-flux trends in the 23 forests (ΔNEP/Δt, ΔGPP/Δt and ΔRe/Δt) and ΔLAI/Δt. Model summaries can be found in Supplementary Information section 1. Corrected maturity age (MatAge) was calculated by dividing the mean stand age by the logging maturity tree age as described by Stokland et al.60 for average productivity classes. See Methods for more information on the calculation of the corrected logging maturity age.
