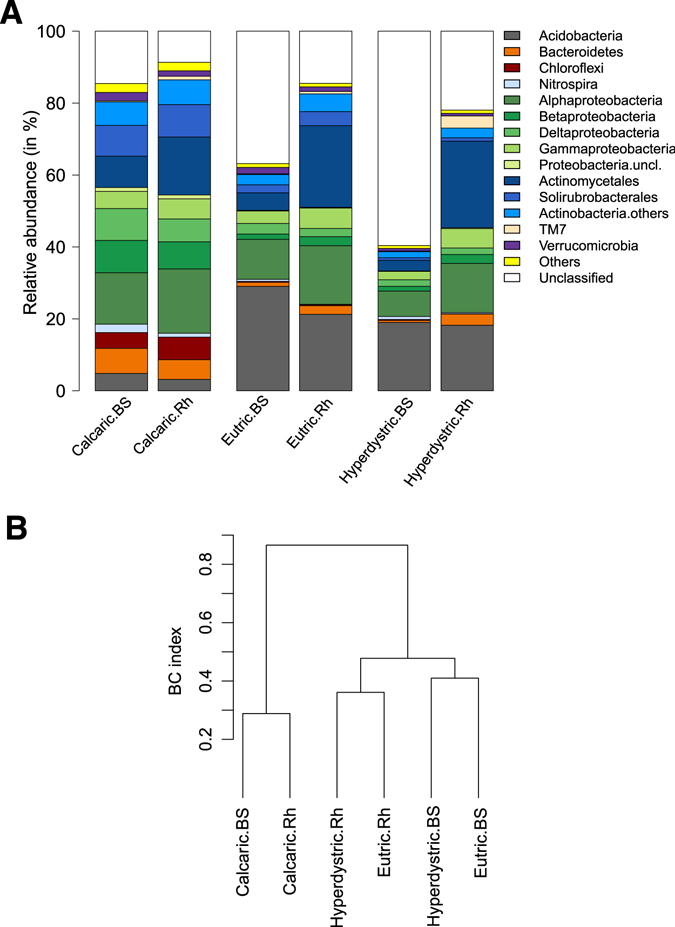
Figure 3.

Distribution of the major bacterial phyla and classes along the toposequence and hierarchical clustering analysis. (A) Taxonomic distribution. The relative abundance of the major phyla and classes was calculated as the percentage of sequences belonging to a particular lineage of all 16S rRNA gene sequences recovered from each sample. The Proteobacteria phylum is represented in green and was detailed for the different classes. The Actinobacteria phylum was represented in blue and was detailed for the Actinomycetales and Solirubrobacterales orders. (B) Hierarchical clustering analysis. A hierarchical clustering based on Bray-Curtis (BC) distance of the major bacterial phyla and classes was performed. Samples are referred as follow: Calcaric.BS: Calcaric bulk soil; Calcaric.Rh: Calcaric rhizosphere; Eutric.BS: Eutric bulk soil; Eutric.Rh: Eutric rhizosphere; Hyperdystric.BS: Hyperdystric bulk soil; Hyperdystric.Rh: Hyperdystric rhizosphere.
