Figure 1.
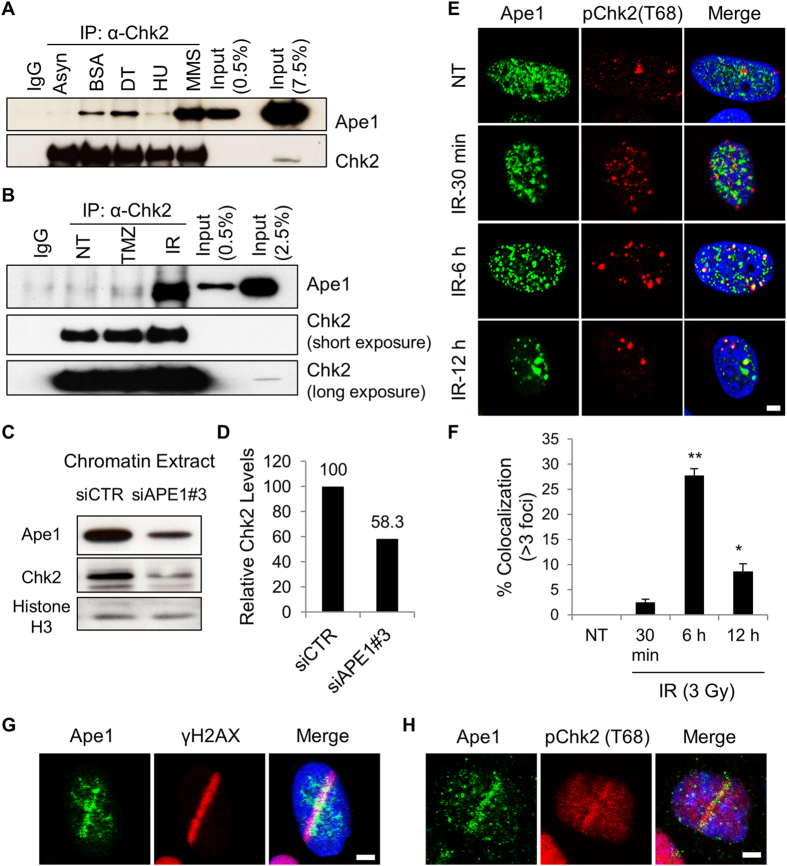
Ape1 is recruited to sites of double-strand breaks of DNA, and cooperates with Chk2. (A) HEK293 cells were treated with BSA (0.5%; 24 h), double thymidine (DT, 2 mM), hydroxyurea (HU, 2 mM; 16 h), or methyl methane sulphonate (MMS, 250 µM; 4 h). MMS treated cells were washed and incubated for another 16 h. Asynchronized cells were left untreated. Cells were then harvested, and subjected to IP. (B) HEK293 cells were either left non-treated (NT), exposed to temozolomide (TMZ, 250 µM, 4 h) or ionizing radiation (IR, 3 Gy). TMZ-treated cells were washed and incubated for another 4 h prior to the harvest. IR-treated cells were harvested 6 h after the IR exposure. Cells were then subjected to IP, followed by immunoblotting for Ape1 and Chk2 proteins. (C) Chromatin fractions were isolated after 72 h of siRNA transfections, and subjected to Western blot. (D) Quantification of relative Chk2 signal at chromatin is shown. (E) U2OS cells were exposed to IR (3 Gy), fixed and stained with the indicated antibodies. Representative images are shown. Scale bar, 5 µm. (F) At least 100 cells per experiment were counted, and cells with at least three colocalizing foci were quantified. Standard deviations were calculated from three independent experiments. **p < 0.001 (IR, 30 min vs. IR, 6 h), *p < 0.02 (IR, 30 min vs. IR, 12 h); Student’s t test (G) U2OS cells were micro-irradiated, fixed after 2 min of laser incision, and stained with Ape1 and γH2AX antibodies. A representative image is presented from at least three independent micro-irradiation experiments. Scale bar, 5 µm. (H) U2OS cells were micro-irradiated, fixed, and stained with Ape1 and phospho-Chk2 (Thr 68). A representative image is presented from at least three independent micro-irradiation experiments. Scale bar, 5 µm.

