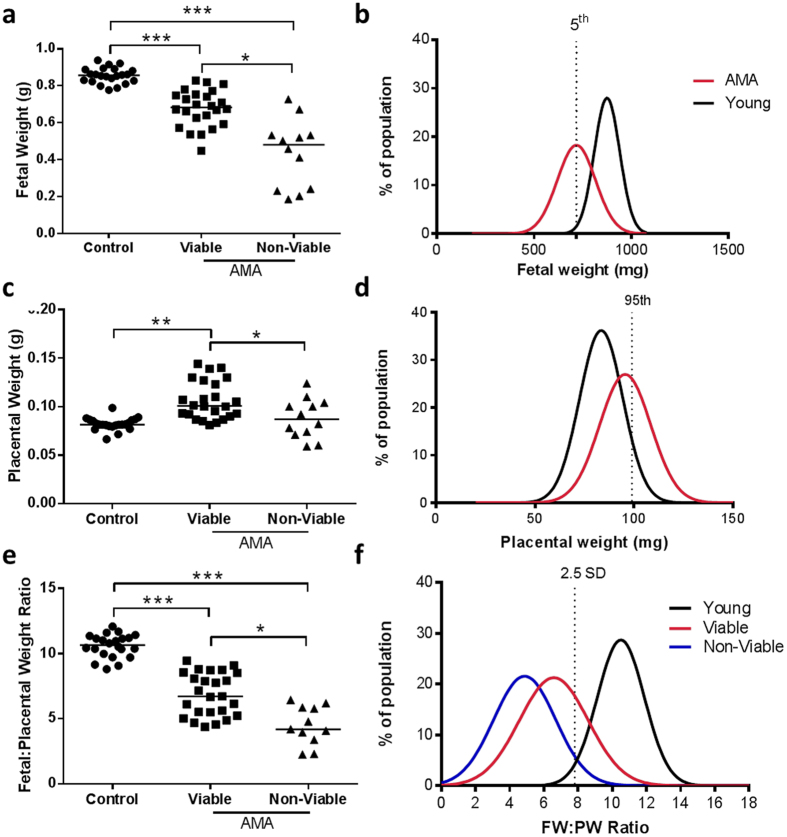
Figure 5.
Fetal and placental measurements from control and advanced maternal age (AMA) mouse pregnancies. (a) Fetal weights, (b) fetal weight frequency distribution, (c) placental weights, (d) placenta weight frequency distribution, (e) fetal:placental weight ratios and (f) fetal:placental weight ratios frequency distribution. Data in (a,c and e) are presented as litter averages [N = 22 for controls (n = 159 individual fetuses), N = 13 for AMA viable (n = 99 individual fetuses), N = 12 for AMA non-viable (n = 14 individual fetuses)]. *p < 0.05, **p < 0.01, ***p < 0.001, Kruskal-Wallis with Dunn’s Multiple Comparison Test. For fetal weight frequency distribution (b) (control = black line, AMA = red line), the dotted line refers to 5th centile of control population. For placental weight frequency distribution (d) the dotted line refers to 95th centile of control population. For FW:PW ratios frequency distribution (f) (control = black line, AMA Viable = red line, AMA Non-Viable = blue line) the dotted line refers or 2.5 standard deviations (SD) away from the mean of control population.

