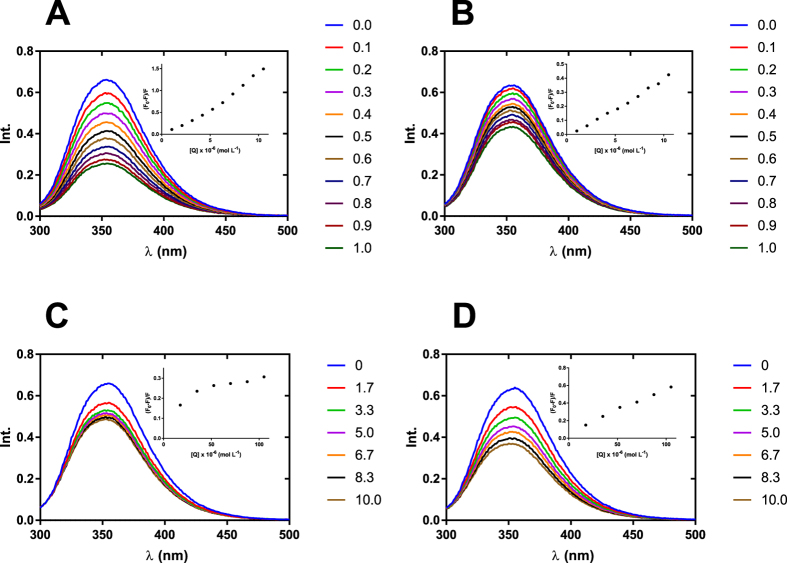
Figure 2.
Fluorescence emission spectra of BSA (10.5 μM) in the presence of: [CoD]− – 1 (A), 4 (B), 7 (C) and 10 (D) in 0.10 M sodium bicarbonate (pH 8.4) with 2% DMSO, λ ex = 280 nm, 298 K. The concentration of 1 and 4 was 0 to 10.5 μM with 1.05 μM intervals; the concentration of 7 and 10 was 0 to 105 μM with 17.5 μM intervals. Detailed molar excess of boron cluster is described in the legend. Inset: Stern-Volmer plots for BSA – boron cluster complexes.

