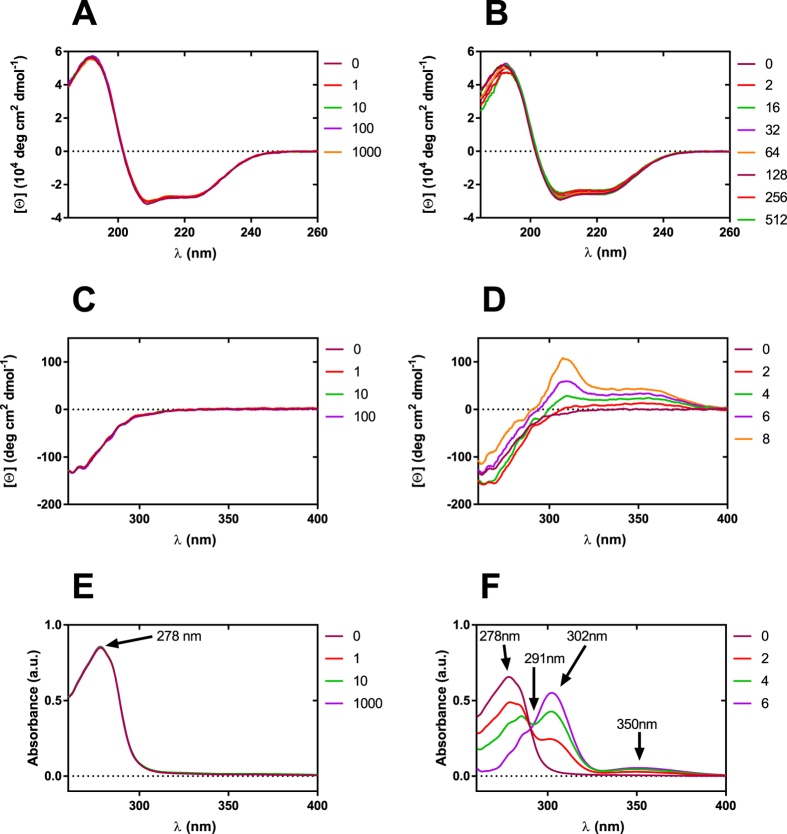
Figure 3.
Circular dichroism and absorption spectra of BSA in the presence of increasing concentration of selected boron clusters. Far UV CD spectra, C(BSA) = 1.5 μM, C([B12H12]2−) in the range 0–1.5 mM (A), C(BSA) = 1.5 μM, C([CoD]−) in the range 0–1.5 mM (B); near UV CD spectra, C(BSA) = 150 μM, C([B12H12]2−) in the range 0–15 mM (C), C(BSA) = 150 μM, C([CoD]−) in the range 0–1.2 mM (D); UV absorption spectra, C(BSA) = 12.6 μM, C([B12H12]2−) in the range 0–12.6 mM (E), C(BSA) = 9.79 μM, C([CoD]−) in the range 0–58.7 μM (F). Detailed molar excess of boron cluster is described in the legend. Far UV CD spectra were measured in NaHCO3 0.01 M and near UV CD and absorption spectra were measured in NaHCO3 0.1 M.

