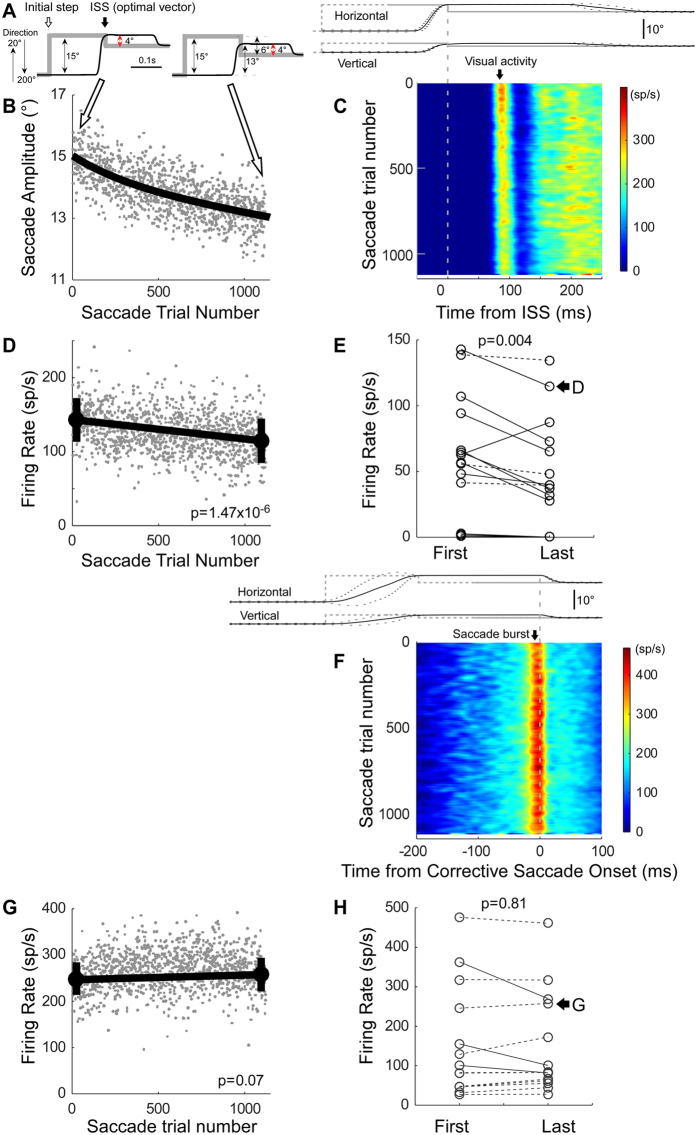
Figure 1.
Activity of visuo-motor neurons during amplitude decrease adaptation. (A–D) Visual activity of a representative neuron in the right SC of monkey-D. (A) Schematic of target (gray lines) and eye (black lines) movements for the beginning and end of adaptation. Target stepped along the neuron’s optimal direction, in this case 200° (rightward: 0°, upward: 90°, leftward: 180°, downward: 90°). During adaptation, the visual error was held constant at 4° (red arrow), i.e., this neuron’s optimal amplitude. (B) Decrease in primary saccade amplitude with saccade trial number. Grey dots represent individual saccades; black line is an exponential fit. (C) Heat map of visual activity during adaptation aligned on ISS onset (time = 0). Upper panel, target (grey) and eye movements (black) for the first 15 saccades during adaptation aligned on ISS onset at end of the primary saccade. Black broken lines indicate 1 standard deviation (SD) of eye movement; grey broken lines approximate the time of the initial target step (because the latency of the primary saccade is variable). (D) Average firing rate of the visual response for individual trials during adaptation (grey dots) and the means of the first and last 50 saccades (black circles, error bars are 1 SD). (E) Mean firing rates of visual activity for 14 visuo-motor neurons. Lines connect the data from each neuron. Solid line indicates a significant decrease, dotted line indicates no significant decrease. (F–H) Saccade-related burst activity. (F,G) The representative neuron in A–D. (F) Heat map of saccade-related burst aligned on corrective saccade onset. Upper panel, target (grey) and eye movements (black) for first 15 saccades during adaptation aligned on corrective saccade onset. (G) Average burst firing rate during adaptation. (H) Mean firing rate of saccade-related activity for the 14 visuo-motor neurons.

