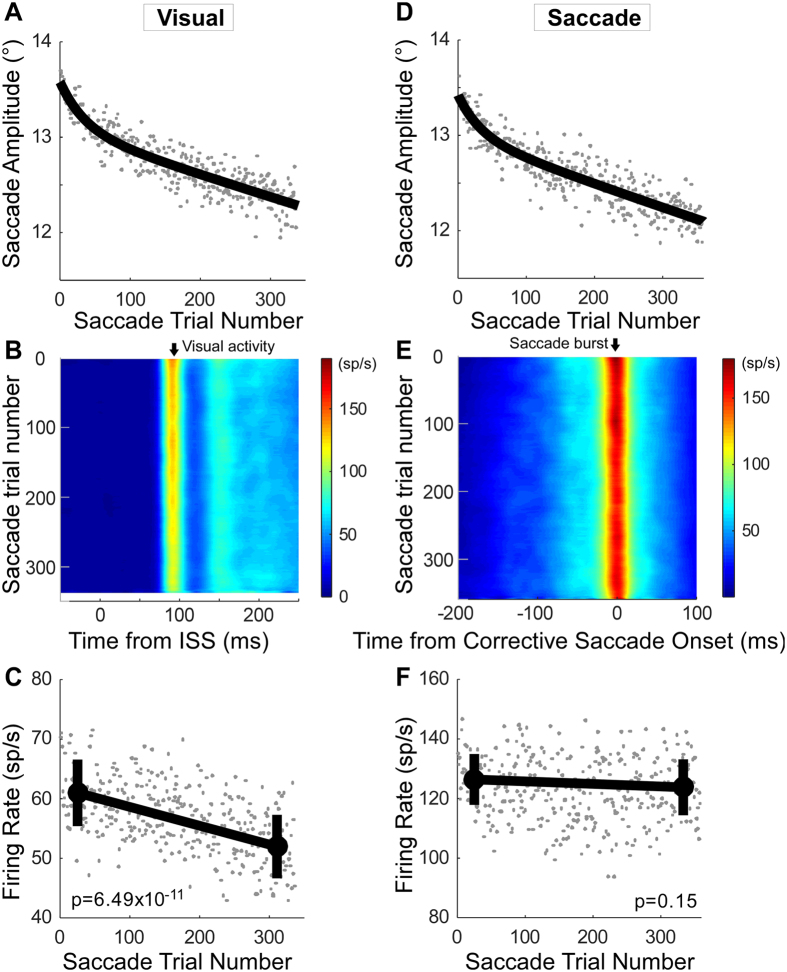
Figure 4.
Summary of visual and saccade-related activity changes during amplitude decrease adaptation. (A–C) Population average of visual activity for 37 neurons. (A) Population change in saccade amplitude during adaptation with exponential fit. (B) associated change in average visual activity aligned on ISS occurrence (0 ms). (C) Average firing rate and the mean of the first and last 50 saccades (±1 SD). (D–F) Population average of saccade burst activity for 35 neurons. (D) Population change in saccade amplitude during adaptation with exponential fit. (E) Associated change in saccade-related burst activity aligned on corrective saccade onset. (F) Average firing rate and the mean of the first and last 50 saccades (±1 SD).

