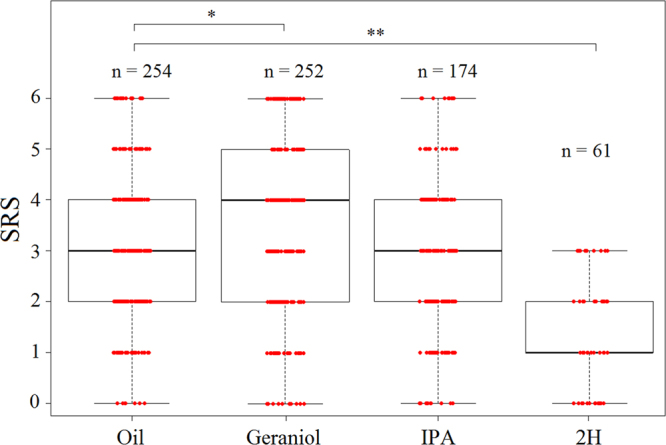
Figure 3.

Pheromone exposure affects individual sucrose response scores (SRS). Median, quartiles and max and min (upper and lower whiskers) SRS values of bees exposed to either mineral oil or to one of the three pheromone components (geraniol, IPA and 2H). Red dots represent individual bees. For each bee, SRS was established by measuring PER to a series of six sucrose solutions of increasing concentration (0.1%, 0.3%, 1%, 3%, 10%, and 30% w/w). SRS values ranged between six (bees responding to all 6 concentrations) and 0 (bees not responding to any concentration). Non-responding bees (i.e. bees not responding even to an additional concentration of 50%; see Fig. 1) were excluded from this analysis as their SRS value could not be established. *p = 0.045; **p < 0.0001.
