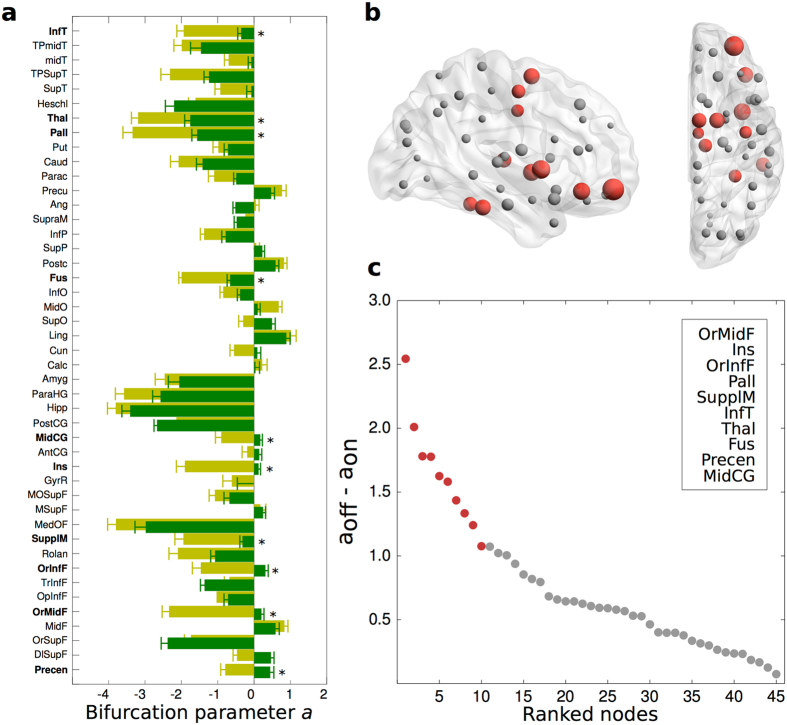
Figure 5.
Local differences in bifurcation parameter values for Parkinson’s disease patients. (a) Here we show the full bar plot of the mean ± standard deviation bifurcation parameter value in each of the 45 nodes from the right hemisphere for both the ON (green) and OFF (orange) condition. Stars and bolded regions highlight nodes with the most pronounced shift. (b) Sagittal and axial view of a brain depicting the absolute bifurcation parameter shift of all nodes. Size represents shift magnitude and red nodes are those ranking in the top 10 with the largest shift. (c) Bifurcation parameter shift represented as the absolute difference between a off and a on. Top 10 nodes are depicted in red and listed in the top-right insert. Table 2 shows the full names of abbreviated brain regions within the AAL parcellation shown. 3D brain generated with BrainNet Viewer79.

