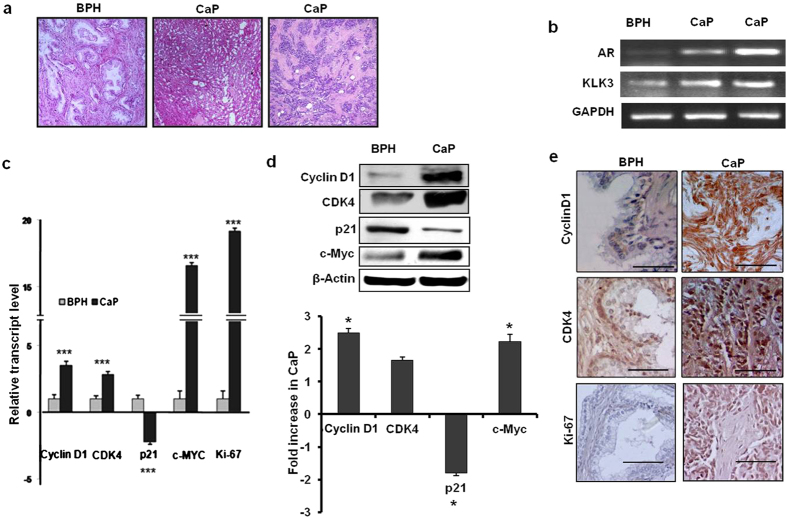
Figure 1.
Histological and molecular criteria of BPH and CaP samples used in Microarray analysis. (a) H&E stained tissue sections of BPH and CaP samples. (b) Semi-quantitative RT-PCR based evaluation of AR and KLK3 genes in patient samples. Glucose-6-phosphate dehydrogenase (GAPDH) was used as an endogenous control. (c) Bar diagram representing relative expression of cell cycle and proliferation genes by quantitative RT-PCR. (***) indicated the P value < 0.001. 18 S rRNA gene was used as an endogenous control. (d) Representative western blots of cyclinD1, CDK4, p21 and c-Myc and in cancer and BPH samples. Human β-actin was used as loading control. Bar diagram in the lower panel showed the fold decrease of proteins in cancer tissues compared to BPH samples. (*) indicated the P value < 0.05. (e) Immunohistochemical evaluation of expression of cyclinD1, CDK4 and Ki-67 proteins in BPH and cancer samples (Bar: 50 µm).

