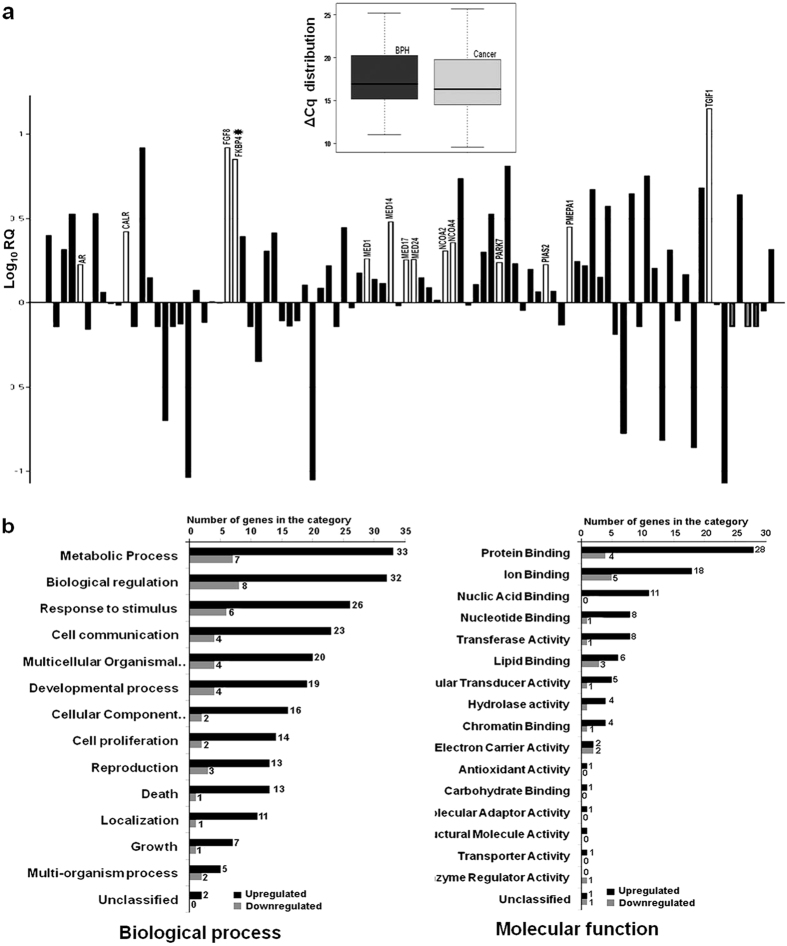
Figure 2.
Relative expression and functional categorization of differentially regulated genes belonging to the AR receptor signaling pathway. (a) Bar diagram showing average fold difference of 94 genes in CaP with respect to BPH. The height of each bar represents Log10RQ of the genes. White colored bars represent over expressed genes belonging to the androgen/intracellular steroid receptor pathway. Box plot in the inset represents an overall higher expression of AR pathway genes in cancer. The bottom line, middle line, and top line of each box represent 25th percentile, median, and 75th percentile, respectively. Bars extend to the lowest value and to the highest value of ΔCq of each group. (b) Differentially regulated genes were categorized based on their affiliations to different Biological Processes or Molecular Functions. Each category was represented by two bars for genes up regulated and down regulated. The height of the bar indicates the number of input genes observed within the category.

