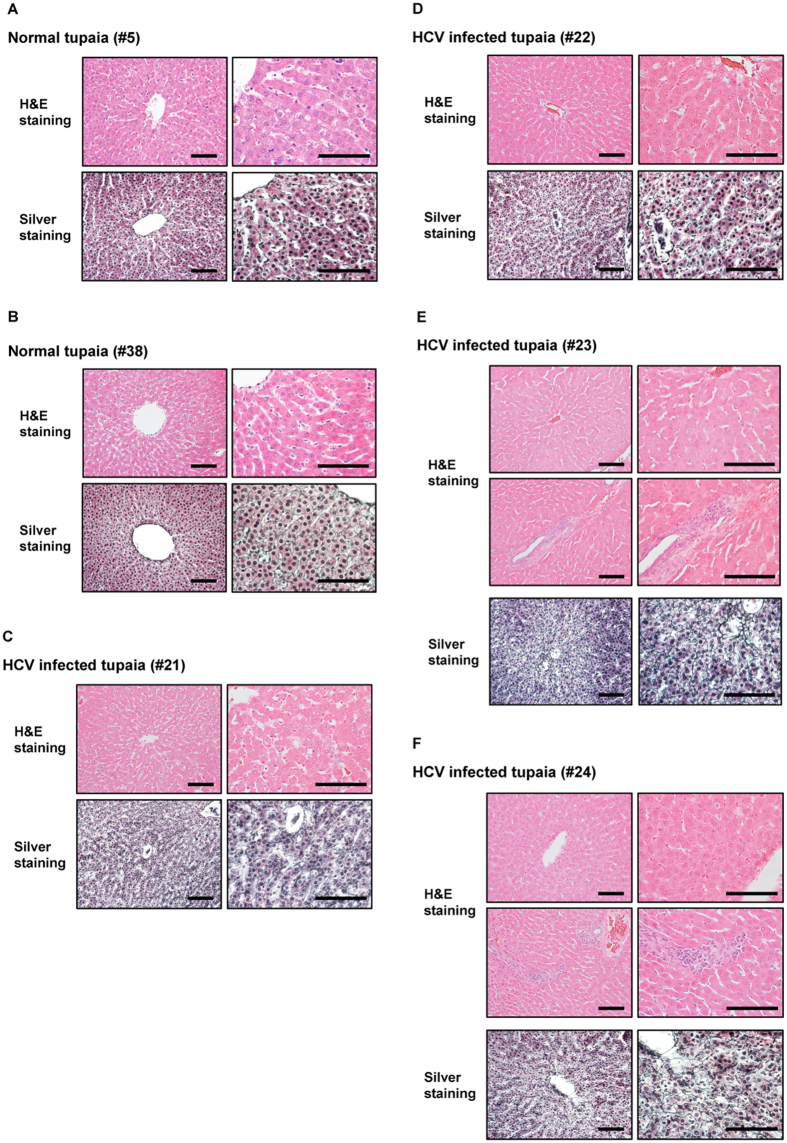
Figure 5.
Histopathological analysis of liver tissues from normal and HCV-infected tupaias at 41 wpi. Histopathological analysis was performed with H&E or silver staining. H&E staining images (upper panel) and silver staining images (lower panel) of liver tissues from (A) Normal tupaia #5, (B) Normal tupaia #38, (C) HCV genotype 1a-infected tupaia #21, (D) HCV genotype 1b-infected tupaia #22, (E) HCV genotype 4a -infected tupaia #23, and (F) HCV genotype 2a -infected tupaia #24 have been shown. Black bars indicate 100 μm.

