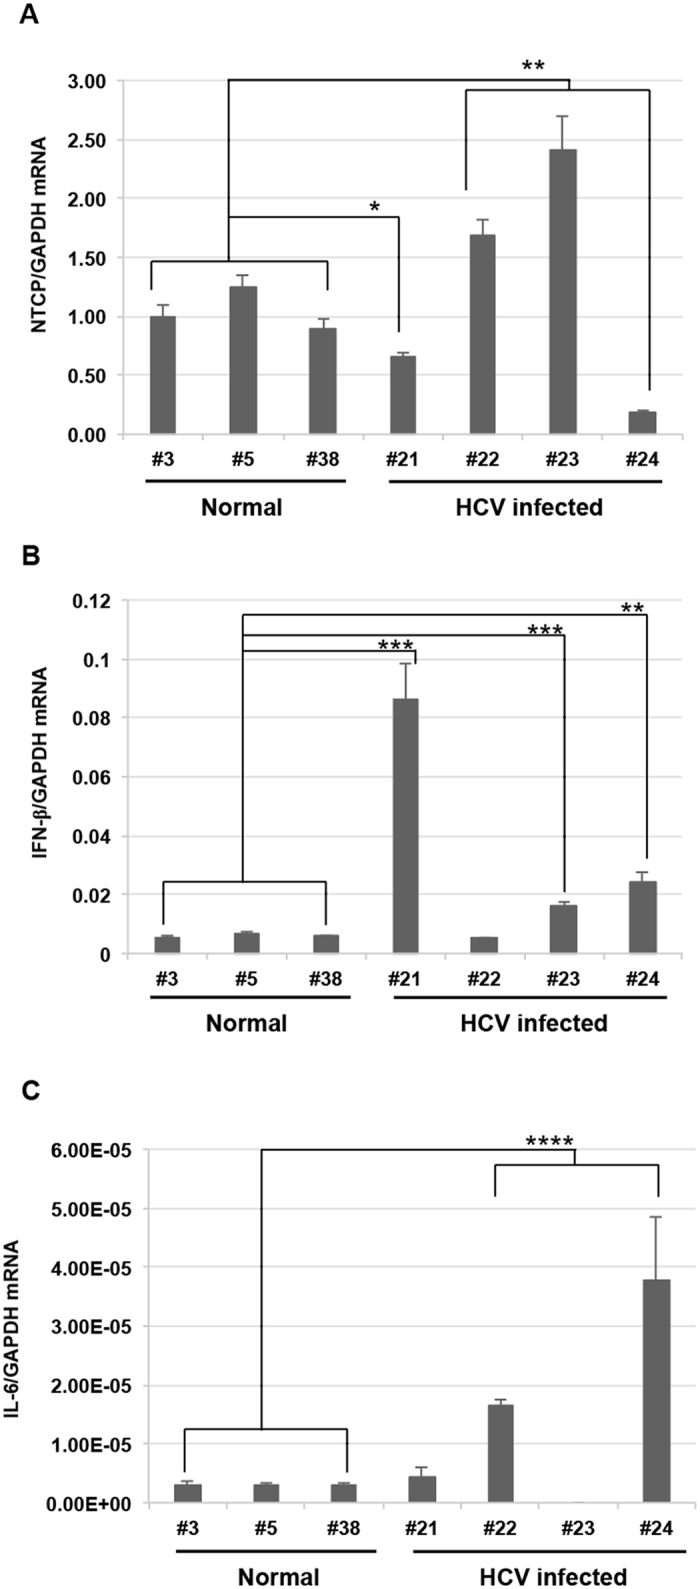
Figure 8.

Changes in the expression of NTCP and cytokine mRNAs in HCV-infected tupaias at 41 wpi. (A) NTCP, (B) IFN-β, and (C) IL-6 mRNA expression in livers of HCV-infected tupaias was measured by one-step qRT-PCR. Gene expression levels were normalized to the expression level of GAPDH mRNA. * p < 0.05, **p < 0.01, ***p < 0.001, and ****p < 0.0001 indicate significant differences compared to normal controls. Data are presented as means ± SDs (n = 3).
