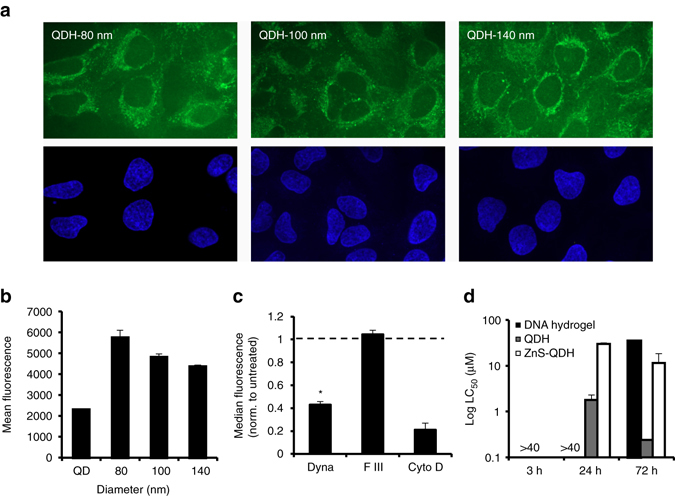
Fig. 4.

Uptake and viability of QDHs in cells. a Cellular accumulation of 80 nm, 100 nm, and 140 nm QDH (green) excluded from nuclei (blue) of HeLa cells. b Quantification of cellular uptake of QD alone and QDH (80 nm, 100 nm, and 140 nm) in HeLa cells by flow cytometry (n = 3). c Elucidation of endocytic uptake method of 80 nm QDH in HeLa cells by flow cytometry (n = 4). Dyna: dynasore,; F III: filipin III; Cyto D: cytochalasin D. One-way ANOVA for treated vs. untreated control *P < 0.01. d Cell viability in HeLa cells. Comparison of LC50 values of DNA hydrogel, QDH, and ZnS-QDH at 3, 24, and 72 h time points (n = 3). All error bars represent s.e.m
