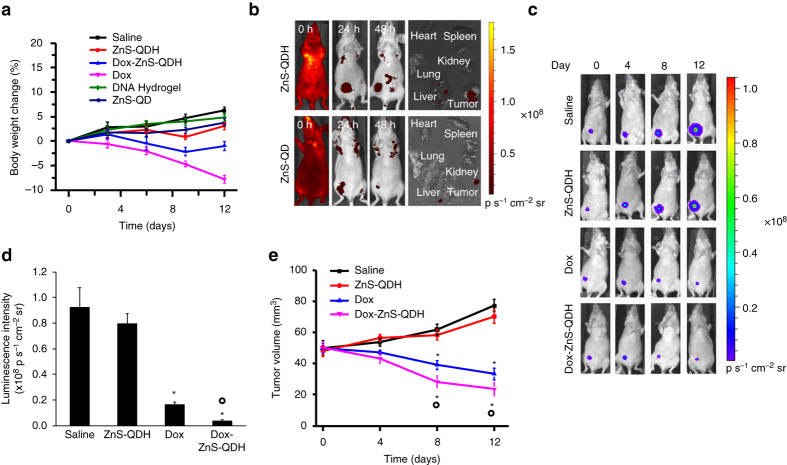
Fig. 6.
Analysis of bioavailability and in vivo efficacy. a Maximum tolerable dose of saline, ZnS-QDH, Dox, Dox-ZnS-QDH, DNA hydrogel, and ZnS-QD treated healthy mice measured by percentage of body weight change from day 0 to 12 (n = 5 per group). b Biodistribution of ZnS-QD and ZnS-QDH after 48 h treatment. c Bioluminescence images of tumors of treated mice from day 0 to 12. d Quantification of bioluminescence on day 12 of treatment regimen. e Analysis of tumor volume of treated MDA-MB-231 breast cancer xenograft mice (n = 5 per group). All error bars represent s.e.m. (n = 5). ANOVA one-way analysis of treated vs. saline control *P < 0.05, vs. Dox °P < 0.05

