Abstract
Novel physical phenomena emerge in ultra-small sized nanomaterials. We study the limiting small-size-dependent properties of MoS2 monolayer rhombic nanoflakes using density-functional theory on structures of size up to Mo35S70 (1.74 nm). We investigate the structural and electronic properties as functions of the lateral size of the nanoflakes, finding zigzag is the most stable edge configuration, and that increasing size is accompanied by greater stability. We also investigate passivation of the structures to explore realistic settings, finding increased HOMO-LUMO gaps and energetic stability. Understanding the size-dependent properties will inform efforts to engineer electronic structures at the nano-scale.
Introduction
Recently two-dimensional (2D) materials have drawn significant interest due to their unique structural, electronic, and optical properties1–3. The existence of 2D materials had been a highly debated issue until the successful exfoliation of graphene from graphite, the first experimentally stable 2D material4. After this revolutionary discovery, many other 2D materials such as silicene, hexagonal boron nitride, and transition-metal dichalcogenides (TMDCs) have also been exfoliated5. These 2D materials are now a widely growing field with a diverse range of applications in nano-electronics3.
Transition-metal dichalcogenides belong to a family of layered materials where each layer is connected through weak Van der Waals forces. They have a general formula of MX2, where M is a transition metal (M = Mo, W, Zr, Hf, etc.) and X is a chalcogen (X = S, Se, Te, etc.). Each layer is three atoms thick with the metal in the centre and the chalcogen atoms above and below the metal6. Nanoflakes of these materials are promising due to the properties emerging from their inter-layer or intra-layer bonding7. Property variations emerge by changing the number of layers or the lateral size within a layer. For example, bulk MoS2 has an indirect band gap of 1.2 eV but when it is thinned down to a single layer, its band gap switches to a direct band gap of 1.88 eV which makes it promising for electronic applications8, 9.
Molybdenum disulphide is a compound which belongs to the hexagonal P63/mmc space group. In its layered structure, each S atom is covalently bonded to three Mo atoms and each Mo atom to six S atoms forming a trigonal prismatic coordination10. The symmetry group of monolayer MoS2 is which contains the discrete symmetries: C 3 trigonal rotation, σ h reflection by the xy plane, σ v reflection by the yz plane, and all of their products11.
There have been significant efforts to understand the size- and edge-dependent, structural and electronic properties of MoS2 monolayer nanoflakes. For example, quantum confinement effects in TMDC nanoflakes have been investigated by Miró et al., both experimentally and through density-functional theory (DFT)7. Wendumu et al. have presented the size-dependent optical properties of 1.6 to 10.4 nm MoS2 nanoflakes12 using the density-functional tight-binding (DFTB) method. An extensive DFT edge-dependence study on MoS2 monolayer nanoribbons has been reported by Pan et al.13. Ellis et al. have studied the band gap tranistion in multilayered MoS2 using DFT in gaussian09 with periodic boundary conditions14. Recently Nguyen et al. have experimentally studied the size-dependent properties of few-layer MoS2 nanosheets and nanodots15 but a complete study of the structural and electronic properties of very small single-layer MoS2 nanoflakes has not yet been presented.
Here we report a DFT study of the 0 K size-dependent properties of 1H MoS2 monolayers of size smaller than 2 nm. We begin our discussion by studying the relative stability of the armchair and zigzag configurations shown in Fig. 1. We present the geometries of the relaxed structures for different nanoflake sizes to thoroughly understand the structural response as a function of lateral size. We report the electronic properties: binding energy, flake formation energy, HOMO-LUMO (highest-occupied molecular orbital to lowest-unoccupied molecular orbital) gap, charge densities; and the passivation of the flakes. We are particularly interested in exploring how the HOMO-LUMO gap changes with the nanoflake size, leading to applications in HOMO-LUMO gap engineering. This is especially important as the HOMO-LUMO gap is the first step in determining the tunable fluorescent properties of nanoflakes, and as MoS2 is known to be biocompatible16, nanoflakes of known size could be useful for biolabelling applications17.
Figure 1.
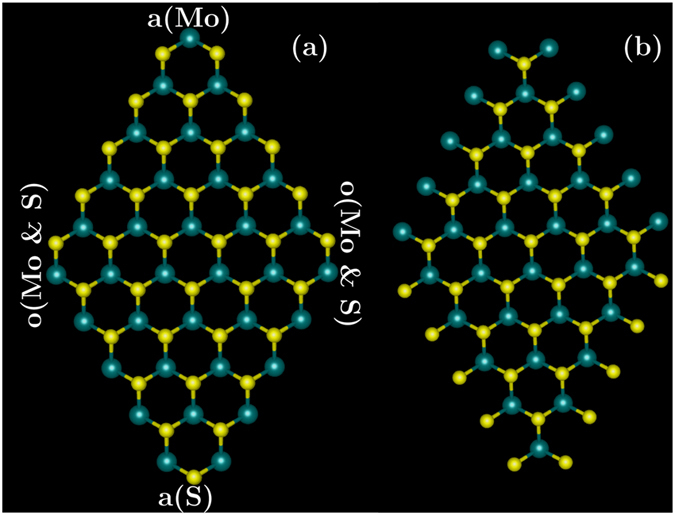
Nanoflakes of MoS2 monolayer having 105 atoms before geometry optimization: (a) zigzag edge configuration; (b) armchair edge configuration. Large, green atoms are Mo and small, yellow are S. Corner labels are defined as: a(Mo) = acute-Mo; a(S) = acute-S; o(Mo & S) = obtuse-Mo and S.
This paper is organized as follows: first we discuss all the required methods and techniques. Then we study two different edge configurations for MoS2 monolayers and find the most stable one, following with a discussion of structural stability as a function of size, the electronic properties and the properties of the passivated structures.
Methods
We investigated the structural and electronic properties of neutral MoS2 monolayer nanoflakes with stoichiometry Mon S2n using DFT in gaussian0918. In experiments, usually triangular shaped islands of MoS2 have been reported but it has been theoretically speculated that MoS2 islands can exist in various shapes, such as trigonal, hexagonal, truncated hexagonal and rhombohedral19–22. We used rhombic flakes to maintain the neutrality and Mon S2n stoichiometry of the flakes. Also, we experienced convergence issues with triangular flakes.
To choose an appropriate functional for our modelling, we conducted an in-depth analysis of the functionals listed in Table 1. We picked a relaxed 72-atom flake as this was the largest size we could model with the B3LYP functional. We compared the relative atomic positions of each atom in the central zone of the 72-atom flake with the bulk structure (infinitely large and regular structure in all three dimensions)23. The displacement ΔR i of each atom from the bulk position is defined as
| 1 |
where i indexes the atoms in the central zone of the 72-atom flake. The mean value of ΔR i, i.e., ΔR for each functional is given in Table 1. All functionals except B3LYP24–26 result in less than 5% variation from the bulk atomic positions. This indicates that the three functionals, BHandHLYP27, PBE1PBE28, and M052X29 predict similar structures at similar levels of accuracy.
Table 1.
Mean displacement, ΔR, of atoms in the central zone of an optimized 72-atom flake from the bulk experimental positions of MoS2 using several functionals in gaussian09. All functionals except B3LYP predict mean displacements less than 5% from the bulk values.
| Functionals | ΔR(Å) |
|---|---|
| PBE1PBE | 0.0256 |
| B3LYP | 0.0565 |
| BHandHLYP | 0.0400 |
| M052X | 0.0330 |
We also calculated the HOMO-LUMO gap as function of flake size for all these functionals as shown in Fig. 2. We expect the HOMO-LUMO gap to decrease with increasing flake size, approaching the experimental monolayer MoS2 gap for larger flakes, as reported by Gan et al.30 through an analytical equation for MoS2 monolayer quantum dots of size from 2 nm to 10 nm. Although our flakes are smaller than 2 nm and we are modelling in DFT, nevertheless we expect a similar trend of approximately decreasing bandgap with increasing flake size. Due to the different methods involved, we only compare the trends, not the absolute values of the HOMO-LUMO gaps. B3LYP and PBE1PBE produce HOMO-LUMO gaps well below the known experimental gap for a large MoS2 monolayer (Fig. 2). Hence, we do not consider these two functionals further. For smaller flakes, BH and HLYP and M052X both produce HOMO-LUMO gaps well above the monolayer experimental value9 and we can expect the band gap with these functionals to converge close to the experimental monolayer band gap for larger flakes. Cramer and Truhlar report that M052X is not a recommended functional for transition metal chemistry31. Considering this, we therefore used the BHandHLYP functional for this article, although we have also performed all the calculations with M052X functional and did not find any major difference in the results. A table showing the HOMO-LUMO responses of the smallest MoS2 monolayer nanoflake for several functionals (in the Supplementary information) also provided us with guidance for the optimal choice of functional for our DFT modelling.
Figure 2.
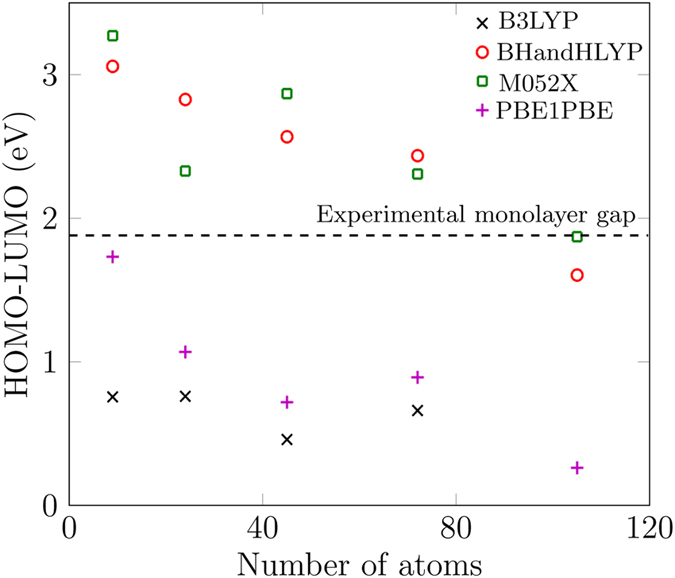
Size-dependent analysis of the HOMO-LUMO gap in MoS2 monolayer nanoflakes using four different functionals. The black-dashed line is the known experimental gap in a large sheet of the MoS2 monolayer9.
The hybrid DFT functional, BHandHLYP27, includes a mixture of Hartree-Fock exchange with the DFT exchange-correlation via the relation
| 2 |
is the Hartree-Fock exchange term, is the Slater local exchange term32, is Becke’s 198824 gradient correction to the local-spin density approximation (LSDA) for the exchange term, and is the Lee-Yang-Parr correlation term25.
The basis set used was an effective-core potential basis set of double-zeta quality, the Los Alamos National Laboratory basis set also known as LANL2DZ33 and developed by Hay and Wadt34–36. These basis sets are widely used in the study of quantum chemistry, particularly for heavy elements33.
gaussian09 optimization criteria: calculations were converged to less than 4.5 × 10⁻³ Hartree/Bohr maximum force, 3 × 10⁻⁴ Hartree/Bohr RMS force, 1.8 × 10⁻³ Hartree maximum displacement, and 1.2 × 10⁻³ Hartree RMS displacement. All the flakes were converged to the default SCF (self-consistent field) limit of <10−8 RMS change in the density matrix except those specified in the next section. The charge multiplicity (net charge) was 0 and the spin multiplicity was 1 (singlet; spin neutral).
In the geometry optimization process, the geometry was modified until a stationary point on the potential surface was found. Analytic gradients were used and the optimization algorithm was the Berny algorithm using GEDIIS37. We calculated the electronic properties of the optimized structures. The charge densities were plotted in avogadro38, 39 from a compatible gaussian09 checkpoint file.
Data availability
The datasets generated and/or analysed during the current study are available from the corresponding author on reasonable request.
Size-dependent structural properties
The properties of MoS2 monolayers are often investigated under the assumption of an infinite slab and real effects arising due to the confinement and boundaries are ignored. A nanoflake is a monolayer with spatial dimensions less than 100 nm. The structural, electronic and optical properties of such nanoflakes will be strongly influenced by varying their lateral size.
We study the MoS2 monolayer nanoflakes for two commonly known edge structures, zigzag and armchair, to investigate the stable edge structure for smaller nanoflakes. Structures before geometry relaxation without any edge termination are shown in Fig. 1. Zigzag structures have double-coordinated, bridge-like S or Mo atoms on the edges [Fig. 1(a)], whilst armchair have single-coordinated, antenna-like S or Mo atoms [Fig. 1(b)]. We relaxed both of these types of structure, encountering convergence issues for the two larger structures (72 atoms and 105 atoms). We succeeded in getting convergence of <10−7 RMS change in the density matrix for the 72-atom structures in both zigzag and armchair edge configurations. For the 105-atom structure, we obtained convergence of <10−5 RMS change in the density matrix in zigzag edge configuration, but could not converge the 105-atom armchair edge configuration at all. This therefore, sets the maximum structure size in our calculations. In gaussian09, the energy change is not a criterion for convergence, however, the worst level of convergence for the largest structure, i.e., <10−5 RMS change in density matrix, typically corresponds to <10−10 Ha change in energy18. For the larger structures, we are more confident of the trends instead of the absolute values of energy.
The ground-state energies as functions of the size of the nanoflakes are shown in Fig. 3. Assuming that the edge width remains constant for any flake size, as the flakes get larger the ratio of number of edge atoms to core atoms decreases significantly because the number of core atoms increases more rapidly. (A quick circular approximation shows the core area ∝L 2, whilst treating the edge as an annulus gives area ∝L, where L is the radius of the core.) The structure becomes more stable as it becomes larger. Figure 3 shows that zigzag-edged structure is more stable than the armchair configuration for nanoflakes of size less than 2 nm. All further properties are discussed for the zigzag edge configuration only because it is the stablest.
Figure 3.
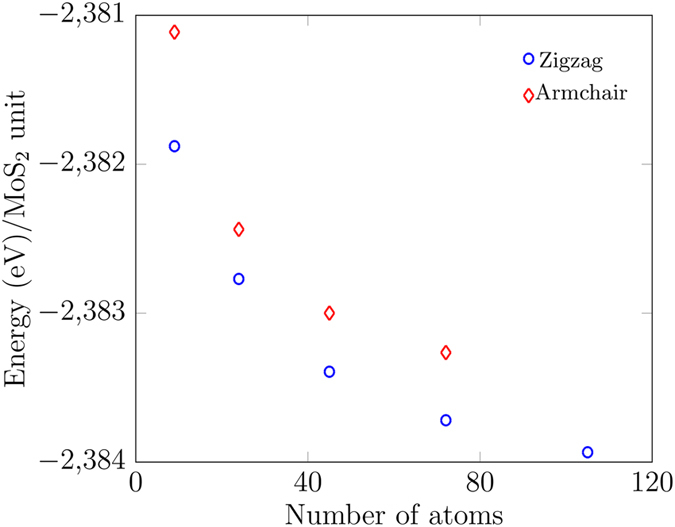
Ground-state energies as functions of size. Blue circles represent the zigzag edge configuration and red diamonds the armchair configuration.
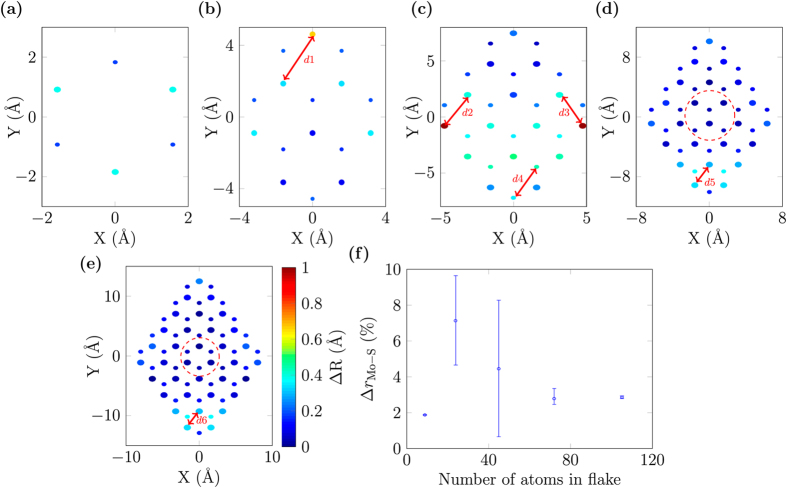
The relaxed structures of MoS2 monolayer nanoflakes are shown in Fig. 4. We compared the atomic positions in the relaxed structures with their unrelaxed positions in the bulk structure23. The colour of the atoms in this figure is proportional to the displacement of atoms from their bulk positions, ΔR i as defined in Eq. (1), with i indexing all the atoms in the flakes.
Figure 4.
Relaxed structures of MoS2 monolayer nanoflakes comprised of: (a) 9 atoms, (b) 24 atoms, (c) 45 atoms, (d) 72 atoms, and (e) 105 atoms. The larger circles are Mo and the smaller are S. The colour of the atoms (ΔR given by Eq. (1)) represents variation of the atomic positions of relaxed structures from the bulk experimental positions23. S atoms are on top of each other along z-axis. The colour bar in (e) and the labels from Fig. 1(a) apply to all subfigures (a–e). The most distorted lengths in each flake are shown by the red-arrowed lines, d1–d6. (f) Percentage variation of the mean Mo–S bond length in the central zone of each flake from the bulk value23. Error bars are extended to the minimum and maximum Mo–S bond lengths in each central zone. The central zones are for (a) and (c) defined similar to that encircled red-dashed in (e), while for (b), it is similar to that encircled red-dashed in (d) as used previously in Table 1.
The smaller nanoflakes are strongly distorted after relaxation compared to their unrelaxed structures except for the 9-atom flake. In the smallest structure having 9 atoms, all the Mo atoms are unsaturated symmetrically and all of them show the same distortion with a mean Mo–Mo length of 2.52 Å, while in the bulk structure this length is reported to be 3.15 Å23. Similarly all the S atoms show the identical distortion with S–S lengths of 3.43 Å. For the 24-atom structure, maximum distortion is observed at the acute-Mo [a(Mo)] corner. This maximum Mo–Mo length is shown by red-arrowed line d1 in Fig. 4(b), and is 2.66 Å. As we move to the next structure (45 atoms), this maximum distortion is shifted to the two obtuse-Mo & S [o(Mo & S)] corners. The unsaturated Mo atoms showing maximum distortion are displaced inwards [Fig. 4(c)]; for example, d2 and d3 are shortened to 2.50 Å while in the bulk structure, they are 3.15 Å. The maximum S–S length distortion in the same structure is d4 = 3.29 Å. As the structures get larger, we observe that the central zones show greatly reduced variation [Fig. 4(f)] after the optimization. For the two larger structures (with 72 and 105 atoms), the maximum distortion is shifted towards the acute-S [a(S)] corner ring [Fig. 4(d,e)]. Both of these structures show identical geometric behaviour and the maximum distortions are on the Mo–Mo lengths shown by red-arrowed lines d5 = d6 = 2.60 Å. These two structures show a well-established core whose mean structural parameters approach the bulk structure values23.
We have done an analysis of the Mo–S bond lengths in the central zones of our relaxed structures and compared them with the bulk Mo–S bond lengths of 2.41 ± 0.06 Å reported in23. Figure 4(f) shows the percentage variation of the mean Mo–S bond lengths in the central zone of each structure with the bulk Mo–S bond length, Δr Mo−S defined as:
| 3 |
The error bars show the range of the minimum and maximum bond lengths in the central zone from the mean value. The smallest flake shows minimum mismatch from the bulk bond lengths. The flake with 24 atoms shows a mean mismatch of 5% from the bulk values. After that as the flake size increases, this percentage mismatch from the bulk values declines and then converges to a value of 2% [Fig. 4(f)] for the two larger structures.
Size-dependent electronic properties
To indicate the stability and the tendency of flakes to grow, we calculated the size-dependent flake-formation energy (FFE) of MoS2 monolayer nanoflakes given by
| 4 |
where n is the number of Mo atoms and 2n the number of S atoms in the flake, E(Mo) is the energy of a single Mo atom, E(S) is the energy of a single S atom, and is the energy of the flake having n Mo atoms and 2n S atoms. As defined, FFE < 0 indicates that the flake is more stable than its constituent atoms. Figure 5 shows that with the increase in nanoflake size the FFE decreases sharply, so more energy is released by adding atoms in the larger flakes indicating that the flakes tend to grow energetically. Conversely, more energy is required to break the larger flakes into their constituents.
Figure 5.
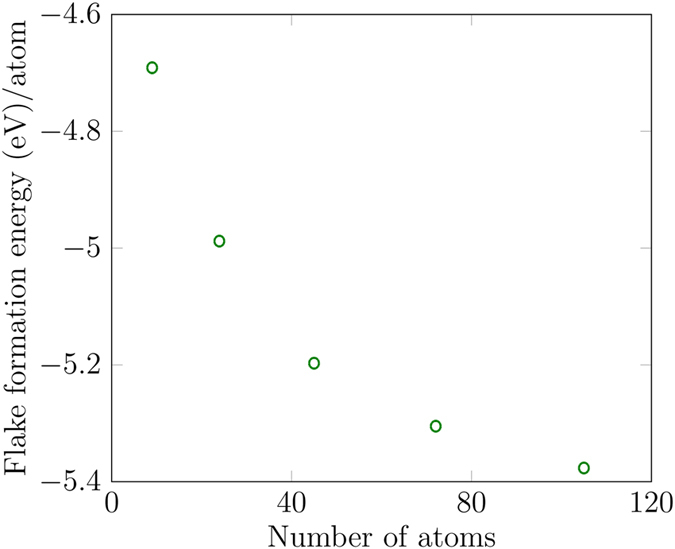
Flake formation energy as a function of nanoflake size. As the size increases, the formation energy decreases.
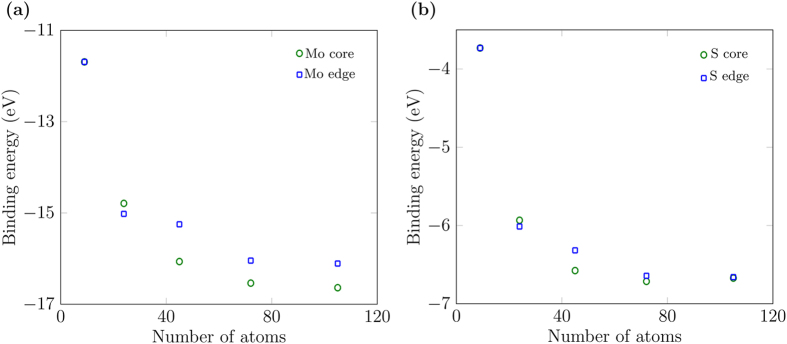
We calculated the binding energies for all flake sizes and present them as a function of size in Fig. 6. We removed a Mo or S atom from as close as possible to the centre of the core or the edge as possible. The binding energy for the Mo atoms is given by
| 5 |
Figure 6.
(a) Binding energies of Mo atoms as functions of number of atoms in the flakes. (b) Binding energies of S atoms as functions of number of atoms in the flakes.
Similarly, the binding energy for S atoms is given by
| 6 |
Negative values of the binding energy indicate that energy is required to remove an atom from a nanoflake. The negative dependence with size means that the cost rises with flake size. For example, removing a Mo atom from the core of a 45-atom flake requires ~1.2 eV more energy than removing it from the core of a 24-atom flake. , where is the defect-formation energy so we can also calculate the energy required to create a Mo or S vacancy in the core or on the edge of the nanoflakes. From Fig. 6, significantly more energy is required to create a Mo vacancy as compared to a S vacancy. Also there is no major difference in the energy required to create a Mo vacancy in the core or in the edge in smaller flakes but as the size of the flakes increases, comparatively it becomes easier for defects to form on the edges. In case of S atoms, approximately the same energy is required to create a S vacancy in the core or in the edge as shown in Fig. 6(b).
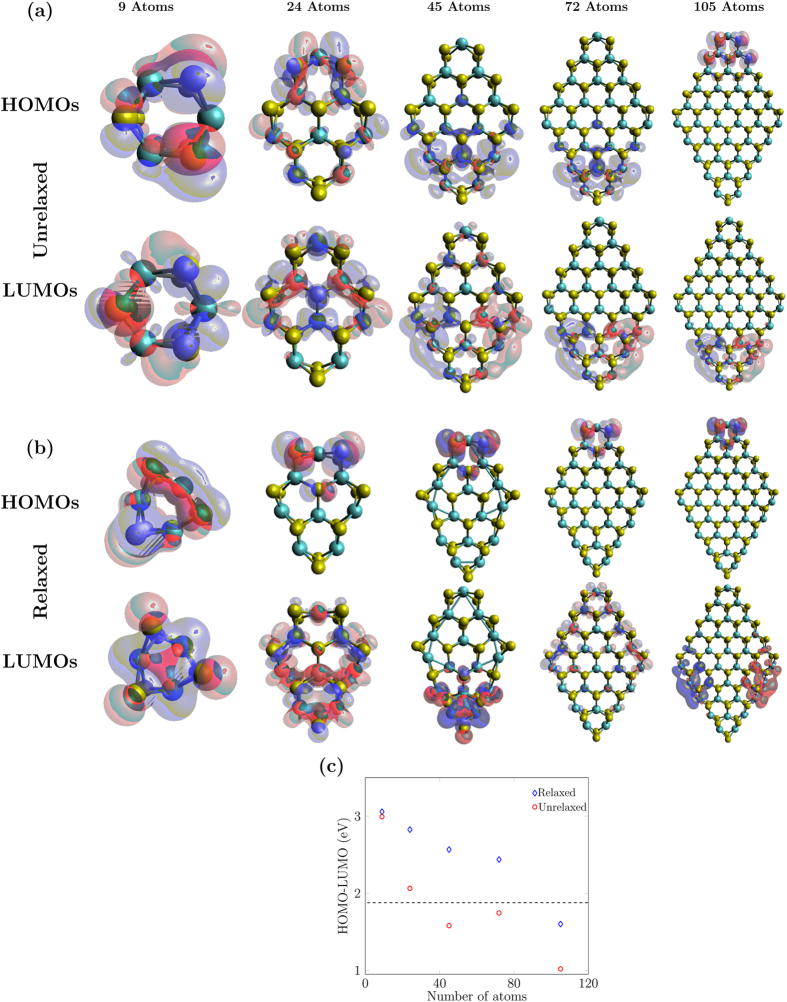
To predict the electronic properties of ultra-small MoS2 monolayer nanoflakes, we calculated their HOMO-LUMO gaps and charge densities of their HOMO and the LUMO (Fig. 7). With an increase in flake size, the HOMO-LUMO gap decreases for both unrelaxed and relaxed structures which is in keeping with intuition around the increase in the HOMO-LUMO gap with decreasing particle size as discussed in the methods section. Mak et al.9 measured the band gap of 1.88 eV for a large MoS2 monolayer sheet as shown by the dashed line in Fig. 7. For larger flakes, we have not observed the band gap converging to this value. One possible cause could be dangling bonds in the nanoflakes. To address this, we study passivated structures in the next section.
Figure 7.
HOMO and LUMO charge densities of (a) unrelaxed, and (b) relaxed zigzag nanoflakes for various flake sizes at an isosurface value of 0.02 e/Bohr3. (c) HOMO-LUMO gaps as functions of size of the nanoflakes for both unrelaxed and relaxed structures. As the size of the nanoflakes increases, the gaps generally decrease. The black-dashed line indicates the known experimental band gap for a large sheet of MoS2 monolayer9.
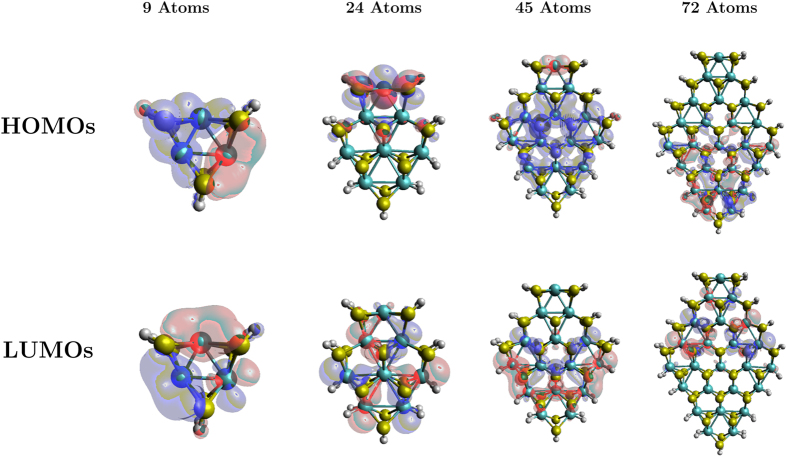
To get deeper insight into the HOMO-LUMO behaviour as a function of nanoflake size, we calculated charge-density plots (Fig. 7) for structures before and after the geometry relaxation. We can see that the majority of the HOMO and the LUMO charge densities are lying on the corners and edges in all of these structures except the 9-atom nanoflake where they are scattered over the whole structure. No single, stand-out trend is observed across all the structures. In short, the charge density is highly sensitive to the structural size for these small sized nanoflakes.
Hydrogen passivation of molybdenum-disulphide nanoflakes
Dangling bonds exist on the edges and corners of the nanoflakes. The smallest structure with 9 atoms has no fully coordinated atoms. The structure with 24 atoms possesses 5 under-coordinated Mo and 10 under-coordinated S atoms. Similarly, the structures with 45, 72, and 105 atoms possess 7 Mo and 14 S, 9 Mo and 18 S, and 11 Mo and 22 S under-coordinated atoms respectively.
It has been reported that the edge Mo atoms with unsaturated bonds may not be stable20, 21. Also in40, Topsoe et al. have reported the presence of S–H groups on the edges of MoS2 clusters experimentally. In ref. 41, Loh et al. have also passivated the S with H atoms in their triangular MoS2 quantum dot on hexagonal boron nitride substrate.
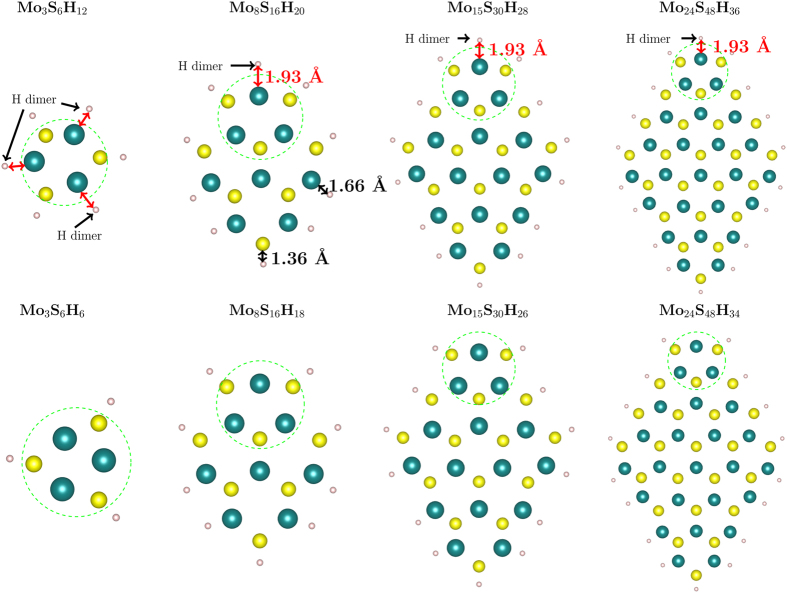
To understand the effects of dangling bonds on the properties of the structures, we passivated both Mo and S edges with H atoms. We passivated each edge Mo atom with two H atoms as we expect Mo atoms to be bonded with six atoms in this particular MoS2 stoichiometry. We also tested single H-termination of all edge Mo atoms and could not obtain converged, relaxed structures. We suspect this means that such structures are energetically unfavourable. We terminated each edge S atom with one H atom as all the central S atoms form three bonds with their neighbouring Mo atoms. We relaxed these passivated structures and observed that on the acute-Mo corner of all the nanoflakes, the H atoms are pushed away and they do not appear to bond to Mo atoms (Fig. 8). We investigated this non-bonding of corner Mo atoms with H atoms by checking their bond lengths. The average Mo–H bond length for all the edge Mo atoms is 1.665 ± 0.005 Å while on the corner it is 1.94 Å. The two H atoms on the Mo corner have an H–H bond length of 78 pm. We calculated the H–H bond length in a lone H dimer as 74 pm which is in good agreement with the known value42. The H–H bond length value, i.e., 78 pm on the acute-Mo corner in all passivated flakes is close enough to the known H–H value that we can believe that they are making a separate H2 molecule.
Figure 8.
MoS2 monolayer nanoflakes passivated with H atoms and relaxed. Each Mo edge atom is passivated with two H atoms and each S edge atom is passivated with one H atom. The top row shows nanoflakes with H dimers not bonded to the flake (labelled). We removed these H dimers, relaxed the nanoflakes again and the relaxed structures are shown in the bottom row. The mean Mo–Mo, S–S lengths and Mo–S bond lengths in the green-encircled ring of each flake are reported in Table 2.
We removed the acute-Mo corner H atoms, relaxed the structures again and observed almost the same structural parameters on the corner as with the corner H atoms. We compared the mean Mo–Mo, S–S, and Mo–S lengths of the acute-Mo corner ring (encircled by green in Fig. 8) in Table 2 for the relaxed structures with and without the H dimer on the corner Mo atom. For all the structures, there is a minimal change in the bond lengths between 0–2%. All the S atoms bond well to one H atom each with an average S–H bond length of 1.365 ± 0.005 Å. We could not obtain a relaxed, converged 105-atom (we are not counting the number of H atoms to keep the number of atoms in each flake consistent with the previous discussion) passivated structure.
Table 2.
A comparison of the mean lengths in the relaxed, passivated structures with and without H dimers on the Mo corner rings, encircled by green on all the structures in Fig. 8.
| Nanoflake size | Mean Mo–Mo (Å) | Mean S–S (Å) | Mean Mo–S (Å) | |||
|---|---|---|---|---|---|---|
| with H dimer | without H dimer | with H dimer | without H dimer | with H dimer | without H dimer | |
| 9 atoms | 2.41 | 2.40 | 3.65 | 3.74 | 2.60 | 2.60 |
| 24 atoms | 2.73 | 2.69 | 3.48 | 3.52 | 2.53 | 2.54 |
| 45 atoms | 2.72 | 2.69 | 3.51 | 3.55 | 2.53 | 2.53 |
| 72 atoms | 2.73 | 2.70 | 3.52 | 3.54 | 2.53 | 2.53 |
There is a maximum mismatch of 2% in the S–S length in the 9 atom structure.
To calculate the stability, we have compared the energies of the passivated structures with the corresponding unpassivated ones. We found that the passivated structures are significantly more stable than the unpassivated ones by 4.33, 5.9, 6.96, and 9.66 eV for 9, 24, 45, and 72 atoms respectively as shown in Fig. 9 where the relative formation energy (RFE) is:
| 7 |
where m is the number of H atoms in the passivated structures.
Figure 9.
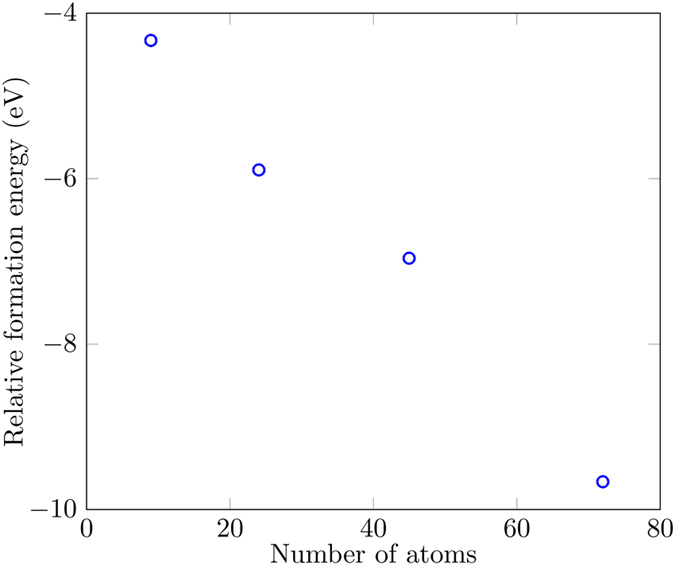
Energy difference between the passivated and unpassivated structures. The passivated structures are significantly more stable than the unpassivated ones in all cases.
Passivation of the dangling bonds modifies the electronic structure, charge densities, and hence the HOMO-LUMO gap. In Fig. 10, the HOMO-LUMO gap of the passivated structures is contrasted against the unpassivated ones. We find that the HOMO-LUMO gap widens with passivation. We suspect this is because of the removal of dangling bonds. This effect is significant in smaller nanoflakes but as the size increases, the ratio of edge to core atoms decreases. Hence, due to fewer edge states in the larger structures, the HOMO-LUMO gap difference (both relative and absolute) between the passivated and the unpassivated structures becomes smaller. The energy level diagram for the unpassivated and passivated flakes is shown in the Supplementary information.
Figure 10.
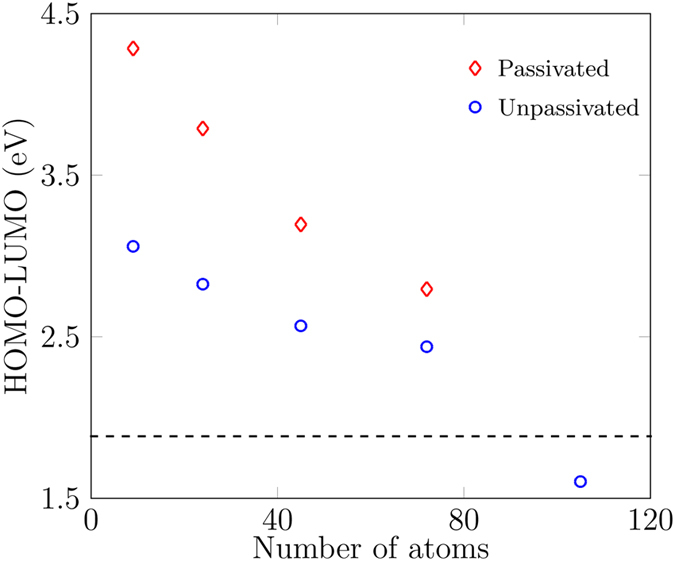
HOMO-LUMO gap of the unpassivated structures (blue circles) versus the passivated structures (red diamonds). Passivated structures have larger HOMO-LUMO gaps. The black-dashed line indicates the known experimental band gap of a large MoS2 monolayer sheet as reported by Mak et al.9.
The charge densities of the passivated structures are shown in Fig. 11. These are much more distributed states in contrast to the charge density plots for unpassivated, relaxed structures [Fig. 7(b)]. Thus passivation makes HOMO/LUMO states in these small-sized flakes more like the expected infinite monolayer.
Figure 11.
Charge densities in the HOMOs and LUMOs of the passivated structures for various sizes of nanoflakes for an isosurface value of 0.02 e/Bohr3. Charge densities are very sensitive to the size of the nanoflakes.
Conclusions
In summary, we have investigated the size-dependent structural and electronic properties of MoS2 monolayer nanoflakes of sizes up to 2 nm using DFT. Our main focus has been to explore the small-sized nanoflakes. We provide more-detailed information for engineering small-sized nanoflakes by reporting the energetically favourable edge configuration and size of the nanoflakes. We predicted the trends in the energetics as functions of size. We passivated the structures to explore the effects of passivation on small-sized nanoflakes. We found the passivated structures to be more stable, with wider HOMO-LUMO gaps than unpassivated ones. We observe several strong size dependencies of various properties.
The size-dependence of the HOMO-LUMO gap of these small-sized nanoflakes holds promise for opto-electronic applications. However, due to the size-dependent energetics involved, one must take care in the manufacture/selection of these flakes. Due to limited computational resources, we were able to model only small-sized nanoflakes and can predict trends for larger flakes only by extending the fit functions. However, an extension of the current work to nanoflakes larger than 2 nm would be a good benchmark for the DFTB size-dependent HOMO-LUMO gaps reported by Wendumu et al.12.
Electronic supplementary material
Acknowledgements
The authors acknowledge financial support from the Australian Research Council (Project Nos DP130104381, CE140100003, FT160100357, LE160100051, CE170100026). This work was supported by computational resources provided by the Australian Government through the National Computational Infrastructure (NCI) under the National Computational Merit Allocation Scheme. The authors thank Rika Kobayashi (NCI) for useful discussion and advice.
Author Contributions
M. Javaid performed all calculations. All authors contributed to analysis and writing the manuscript.
Competing Interests
The authors declare that they have no competing interests.
Footnotes
Electronic supplementary material
Supplementary information accompanies this paper at doi:10.1038/s41598-017-09305-y
Publisher's note: Springer Nature remains neutral with regard to jurisdictional claims in published maps and institutional affiliations.
References
- 1.Novoselov KS, et al. Two-dimensional gas of massless Dirac fermions in graphene. Nature. 2005;438:197–200. doi: 10.1038/nature04233. [DOI] [PubMed] [Google Scholar]
- 2.Miro P, Audiffred M, Heine T. An atlas of two-dimensional materials. Chem. Soc. Rev. 2014;43:6537–6554. doi: 10.1039/C4CS00102H. [DOI] [PubMed] [Google Scholar]
- 3.Mak KF, Shan J. Photonics and optoelectronics of 2D semiconductor transition metal dichalcogenides. Nat. Photon. 2016;10:216–226. doi: 10.1038/nphoton.2015.282. [DOI] [Google Scholar]
- 4.Geim AK, Novoselov KS. The rise of graphene. Nat. Mater. 2007;6:183–191. doi: 10.1038/nmat1849. [DOI] [PubMed] [Google Scholar]
- 5.Li X, Zhu H. Two-dimensional MoS2: Properties, preparation, and applications. J. Materiomics. 2015;1:33–44. doi: 10.1016/j.jmat.2015.03.003. [DOI] [Google Scholar]
- 6.Wang QH, Kalantar-Zadeh K, Kis A, Coleman JN, Strano MS. Electronics and optoelectronics of two-dimensional transition metal dichalcogenides. Nat. Nanotechnol. 2012;7:699–712. doi: 10.1038/nnano.2012.193. [DOI] [PubMed] [Google Scholar]
- 7.Miró P, Han JH, Cheon J, Heine T. Hexagonal transition-metal chalcogenide nanoflakes with pronounced lateral quantum confinement. Angew. Chem. Int. Ed. 2014;53:12624–12628. doi: 10.1002/anie.201309280. [DOI] [PubMed] [Google Scholar]
- 8.Splendiani A, et al. Emerging photoluminescence in monolayer MoS2. Nano Lett. 2010;10:1271–1275. doi: 10.1021/nl903868w. [DOI] [PubMed] [Google Scholar]
- 9.Mak KF, Lee C, Hone J, Shan J, Heinz TF. Atomically thin MoS2: a new direct-gap semiconductor. Phys. Rev. Lett. 2010;105 doi: 10.1103/PhysRevLett.105.136805. [DOI] [PubMed] [Google Scholar]
- 10.Kadantsev ES, Hawrylak P. Electronic structure of a single MoS2 monolayer. Solid State Commun. 2012;152:909–913. doi: 10.1016/j.ssc.2012.02.005. [DOI] [Google Scholar]
- 11.Xiao D, Liu G-B, Feng W, Xu X, Yao W. Coupled spin and valley physics in monolayers of MoS2 and other group-VI dichalcogenides. Phys. Rev. Lett. 2012;108 doi: 10.1103/PhysRevLett.108.196802. [DOI] [PubMed] [Google Scholar]
- 12.Wendumu TB, Seifert G, Lorenz T, Joswig J-O, Enyashin A. Optical properties of triangular molybdenum disulfide nanoflakes. J. Phys. Chem. Lett. 2014;5:3636–3640. doi: 10.1021/jz501604j. [DOI] [PubMed] [Google Scholar]
- 13.Pan H, Zhang Y-W. Edge-dependent structural, electronic and magnetic properties of MoS2 nanoribbons. J. Mater. Chem. 2012;22:7280–7290. doi: 10.1039/c2jm15906f. [DOI] [Google Scholar]
- 14.Ellis JK, Lucero MJ, Scuseria GE. The indirect to direct band gap transition in multilayered MoS2 as predicted by screened hybrid density functional theory. Appl. Phys. Lett. 2011;99 doi: 10.1063/1.3672219. [DOI] [Google Scholar]
- 15.Nguyen TP, Sohn W, Oh JH, Jang HW, Kim SY. Size-dependent properties of two-dimensional MoS2 and WS2. J. Phys. Chem. C. 2016;120:10078–10085. doi: 10.1021/acs.jpcc.6b01838. [DOI] [Google Scholar]
- 16.Wang S, et al. Biocompatible pegylated MoS2 nanosheets: Controllable bottom-up synthesis and highly efficient photothermal regression of tumor. Biomaterials. 2015;39:206–217. doi: 10.1016/j.biomaterials.2014.11.009. [DOI] [PubMed] [Google Scholar]
- 17.Reineck P, Gibson BC. Near-infrared fluorescent nanomaterials for bioimaging and sensing. Advanced Optical Materials. 2017;5 doi: 10.1002/adom.201600446. [DOI] [Google Scholar]
- 18.Gaussian09Ⓡ version 3.5a, gaussian, Inc., Wallingford CT (2013).
- 19.Bertram N, et al. Nanoplatelets made from MoS2 and WS2. Chem. Phys. Lett. 2006;418:36–39. doi: 10.1016/j.cplett.2005.10.046. [DOI] [Google Scholar]
- 20.Lauritsen JV, et al. Size-dependent structure of MoS2 nanocrystals. Nat. Nano. 2007;2:53–58. doi: 10.1038/nnano.2006.171. [DOI] [PubMed] [Google Scholar]
- 21.Helveg S, et al. Atomic-scale structure of single-layer MoS2 nanoclusters. Phys. Rev. Lett. 2000;84:951–954. doi: 10.1103/PhysRevLett.84.951. [DOI] [PubMed] [Google Scholar]
- 22.Seifert G, Tamuliene J, Gemming S. Comput. Mater. Sci. 2006. MonS2n+x clusters—magic numbers and platelets; pp. 316–320. [Google Scholar]
- 23.Dickinson RG, Pauling L. The crystal structure of molybdenite. J. Am. Chem. Soc. 1923;45:1466–1471. doi: 10.1021/ja01659a020. [DOI] [Google Scholar]
- 24.Becke AD. Density-functional exchange-energy approximation with correct asymptotic behavior. Phys. Rev. A. 1988;38:3098–3100. doi: 10.1103/PhysRevA.38.3098. [DOI] [PubMed] [Google Scholar]
- 25.Lee C, Yang W, Parr RG. Development of the Colle-Salvetti correlation-energy formula into a functional of the electron density. Phys. Rev. B. 1988;37:785–789. doi: 10.1103/PhysRevB.37.785. [DOI] [PubMed] [Google Scholar]
- 26.Stephens PJ, Devlin FJ, Chabalowski CF, Frisch MJ. Ab initio calculation of vibrational absorption and circular dichroism spectra using density functional force fields. J. Phys. Chem. 1994;98:11623–11627. doi: 10.1021/j100096a001. [DOI] [Google Scholar]
- 27.Becke AD. A new mixing of Hartree-Fock and local density-functional theories. J. Chem. Phys. 1993;98:1372–1377. doi: 10.1063/1.464304. [DOI] [Google Scholar]
- 28.Adamo C, Barone V. Toward reliable density functional methods without adjustable parameters: The PBE0 model. J. Chem. Phys. 1999;110:6158–6170. doi: 10.1063/1.478522. [DOI] [Google Scholar]
- 29.Zhao Y, Schultz NE, Truhlar DG. Design of density functionals by combining the method of constraint satisfaction with parametrization for thermochemistry, thermochemical kinetics, and noncovalent interactions. J. Chem. Theory Comput. 2006;2:364–382. doi: 10.1021/ct0502763. [DOI] [PubMed] [Google Scholar]
- 30.Gan ZX, et al. Quantum confinement effects across two-dimensional planes in MoS2 quantum dots. Appl. Phys. Lett. 2015;106 doi: 10.1063/1.4922551. [DOI] [Google Scholar]
- 31.Cramer CJ, Truhlar DG. Density functional theory for transition metals and transition metal chemistry. Phys. Chem. Chem. Phys. 2009;11:10757–10816. doi: 10.1039/b907148b. [DOI] [PubMed] [Google Scholar]
- 32.Slater, J. C. The self-consistent field for molecules and solids. Quantum theory of molecules and solids. Vol. 4 (New York NY: McGraw-Hill, 1974).
- 33.Chiodo S, Russo N, Sicilia E. LANL2DZ basis sets recontracted in the framework of density functional theory. J. Chem. Phys. 2006;125 doi: 10.1063/1.2345197. [DOI] [PubMed] [Google Scholar]
- 34.Hay PJ, Wadt WR. Ab initio effective core potentials for molecular calculations. Potentials for the transition metal atoms Sc to Hg. J. Chem. Phys. 1985;82:270–283. doi: 10.1063/1.448799. [DOI] [Google Scholar]
- 35.Hay PJ, Wadt WR. Ab initio effective core potentials for molecular calculations. Potentials for K to Au including the outermost core orbitals. J. Chem. Phys. 1985;82:299–310. doi: 10.1063/1.448975. [DOI] [Google Scholar]
- 36.Wadt WR, Hay PJ. Ab initio effective core potentials for molecular calculations. Potentials for main group elements Na to Bi. J. Chem. Phys. 1985;82:284–298. doi: 10.1063/1.448800. [DOI] [Google Scholar]
- 37.Li X, Frisch MJ. Energy-represented direct inversion in the iterative subspace within a hybrid geometry optimization method. J. Chem. Theory Comput. 2006;2:835–839. doi: 10.1021/ct050275a. [DOI] [PubMed] [Google Scholar]
- 38.Avogadro: an open-source molecular builder and visualization tool. Version http://avogadro.openmolecules.net/.
- 39.Hanwell MD, et al. Avogadro: an advanced semantic chemical editor, visualization, and analysis platform. J. Cheminform. 2012;4:1–17. doi: 10.1186/1758-2946-4-17. [DOI] [PMC free article] [PubMed] [Google Scholar]
- 40.Topsoe NY, Topsoe H. FTIR studies of Mo/Al2O3-based catalysts: II Evidence for the presence of SH groups and their role in acidity and activity. J. Catal. 1993;139:641–651. doi: 10.1006/jcat.1993.1056. [DOI] [Google Scholar]
- 41.Loh GC, Pandey R, Yap YK, Karna SP. MoS2 quantum dot: Effects of passivation, additional layer, and h-BN substrate on its stability and electronic properties. J. Phys. Chem. C. 2015;119:1565–1574. doi: 10.1021/jp510598x. [DOI] [Google Scholar]
- 42.Carruth, G. & Eugene, E. Bond energies (Vol. 1, Tennessee: Southwestern, 2002).
Associated Data
This section collects any data citations, data availability statements, or supplementary materials included in this article.
Supplementary Materials
Data Availability Statement
The datasets generated and/or analysed during the current study are available from the corresponding author on reasonable request.


