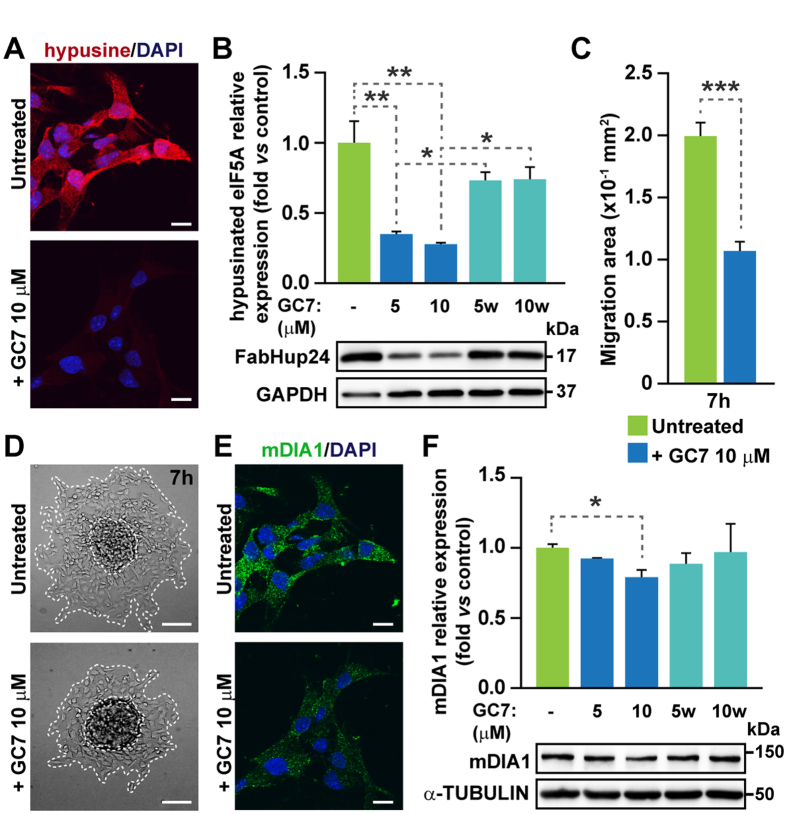
Figure 5.
Cell migration and Dia levels are regulated by eIF5A in mouse NSCs. (A) Immunocytochemistry for hypusine and DAPI staining in migrating neurospheres with or without 10 μM GC7. (B) Western blot for hypusinated eIF5A (FabHpu24) and control GAPDH in NSCs treated during 3 days with GC7 (5 and 10 μM) and then washed and cultured for 3 more days (5w and 10w) (n = 3). (C) Quantification of the migration area of individual neurospheres 7 h after treatment (32 to 44 neurospheres analyzed). (D) Representative images of the neurosphere migration assay. Migration front and original neurosphere are marked with dashed lines. (E) Immunocytochemistry for mDIA1 and DAPI staining in untreated and GC7 treated neurospheres in migration conditions. (F) Western blot for mDIA1 and control α-TUBULIN in NSCs treated for 3 days and then washed (n = 3). Two-tailed Student’s t-test analysis: *p < 0.05, **p < 0.01, ***p < 0.001. Scale bars: A and E, 10 μM; D, 100 μm.

