
Figure 11.
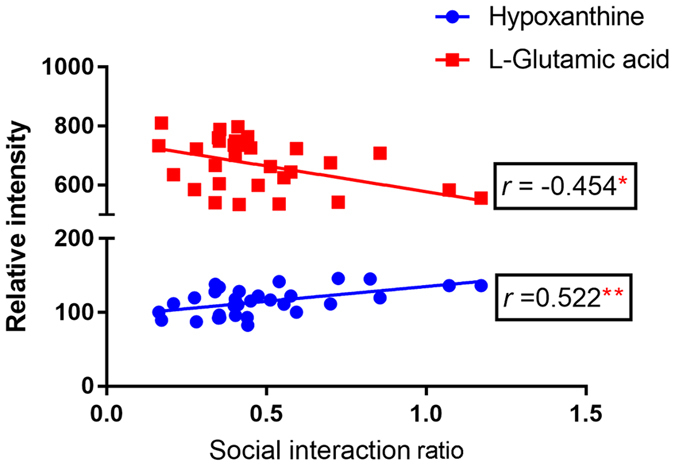
Correlation of differential metabolites with the social interaction ratio (n = 31). *P = 0.010 (L- glutamine vs. social interaction ratio); **P = 0.003 (hypoxathine vs. social interaction ratio), by Pearson’s test.
Official websites use .gov
A
.gov website belongs to an official
government organization in the United States.
Secure .gov websites use HTTPS
A lock (
) or https:// means you've safely
connected to the .gov website. Share sensitive
information only on official, secure websites.
Correlation of differential metabolites with the social interaction ratio (n = 31). *P = 0.010 (L- glutamine vs. social interaction ratio); **P = 0.003 (hypoxathine vs. social interaction ratio), by Pearson’s test.