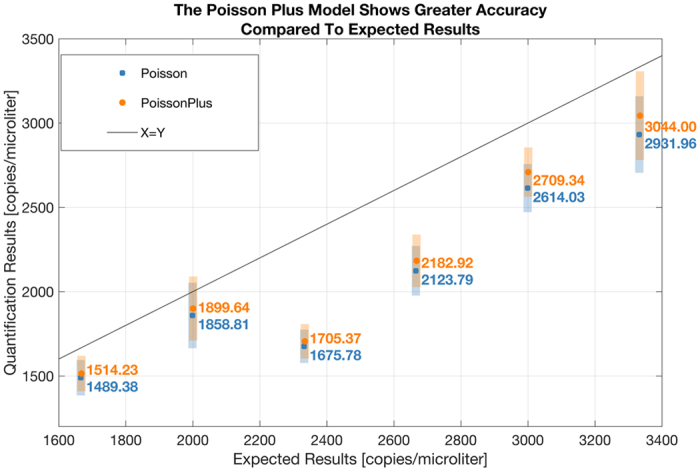
Figure 5.

The p values from a t-test between results from the Poisson and the Poisson Plus modeling, at each concentration, is given as follows: 0.00000117, 0.04, 0.000003, 0.0002, 0.000004. The results suggest a significant difference in the means of the two distributions at the 95% confidence level at these concentrations. The mean result from each model along with a ± one standard deviation around this mean value is shown in the figure. The Poisson Plus results are consistently closer to the line of equivalence constructed with the expected results, suggesting a greater accuracy of the Poisson Plus Model at these concentrations.
