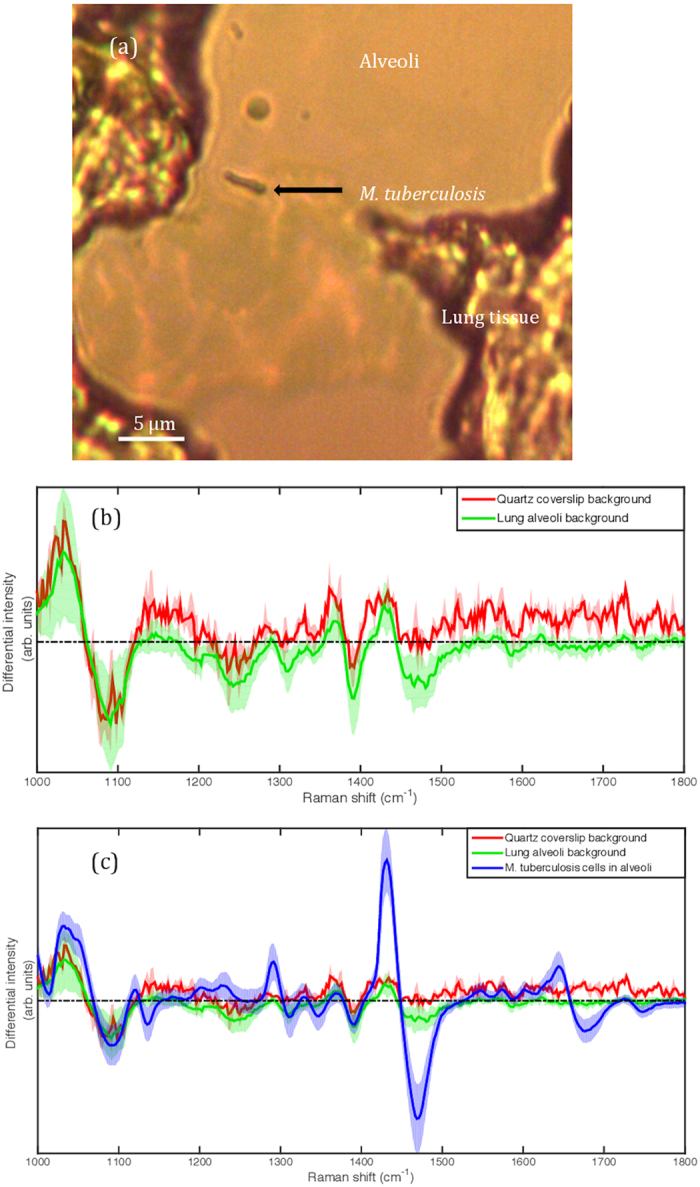
Figure 1.

Investigation of the impact of the lung alveoli to the bacterial Raman spectrum. (a) shows an example of single bacillus in a lung alveoli interrogated by WMR spectroscopy. The scale bar corresponds to 5 μm. (b) presents the average Raman spectrum of the quartz slide surface (red line) and the average Raman spectrum of the lung alveoli (background)(green line). The tissue section like any other preparation interrogated with WMR spectroscopy is on a quartz coverslip. (c) the average spectrum of M. tuberculosis cells acquired in tissue are added (blue line) and compared with the lung alveoli and the quartz slide background. In both Fig. 1b and c the shaded coloured areas represent the standard deviation. In Fig. 1b and c the x-axis is in wavenumbers. The y-axis represents the differential intensity in arbitrary units.
