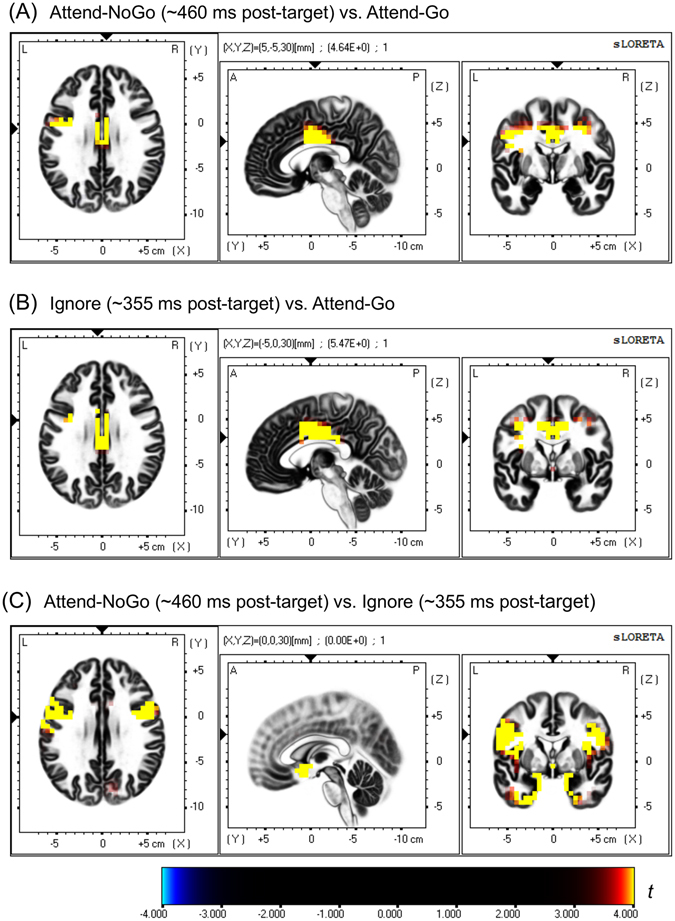
Figure 6.

sLORETA-based Statistical non-Parametric Mapping (SnPM) of within-subject comparisons between different experimental conditions for the current density values of P3 component (Panel A: Attend-NoGo vs. Attend-Go; Panel B: Ignore vs. Attend-Go; Panel C: Attend-NoGo vs. Ignore). Each panel consists of slice views from axial, sagittal and coronal planes for the same brain area. The corresponding t-values of statistical significance (corrected p = 0.05, 2-tailed) are 3.909, 3.937 and 3.879 in A, B and C, respectively.
