Figure 7.
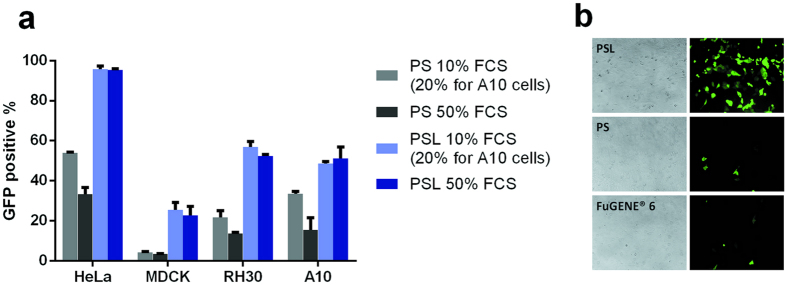
Transfection of other cell lines. (a) Comparison of other cell lines transfected with PS and PSL complexes in different concentrations of FCS. Transfection efficiency determined by flow cytometry. (b) Comparison of PSL complexes mediated transfection with FuGENE® HD and FuGENE® 6 in MDCK cells. Transfection was performed at a dose of 0.3 μg of DNA per well in a total volume of 200 μl. GFP expression was quantified by fluorescence microscope. Data represent mean ± standard deviation of 3 independent experiments.

