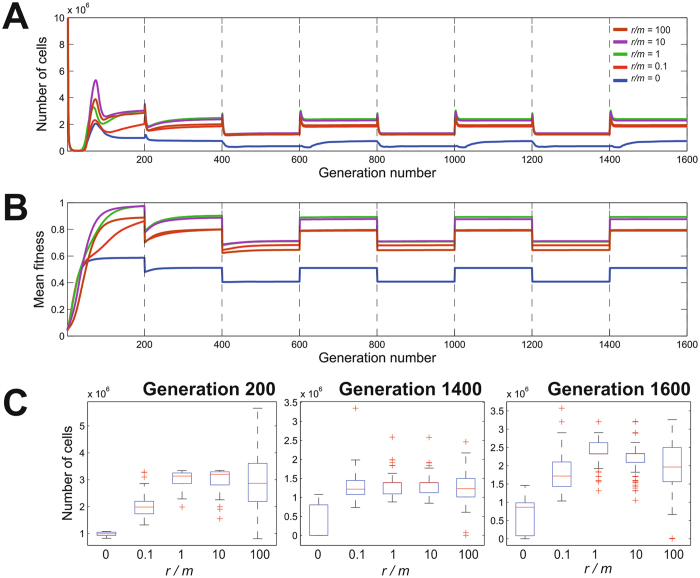
Figure 3.
Rapid multiple host transitions with different recombination rates. Number of cells (A) and mean fitness (B) for recombination to mutation ratios of r/m = 0 (blue), r/m = 0.1 (red), r/m = 1 (green), r/m = 10 (magenta) and r/m = 100 (brown) as they progress through several niche transfers (broken lines), for which selective pressures are alternatively imposed to favor genes specifying adaptation to one or the other host. (C) Population growth distribution at various recombination rates at generations 200 (transition from composite niche to the first host), 1400 (last transition growth phase in host 2) and 1600 (end of simulation after 6 host switches).

