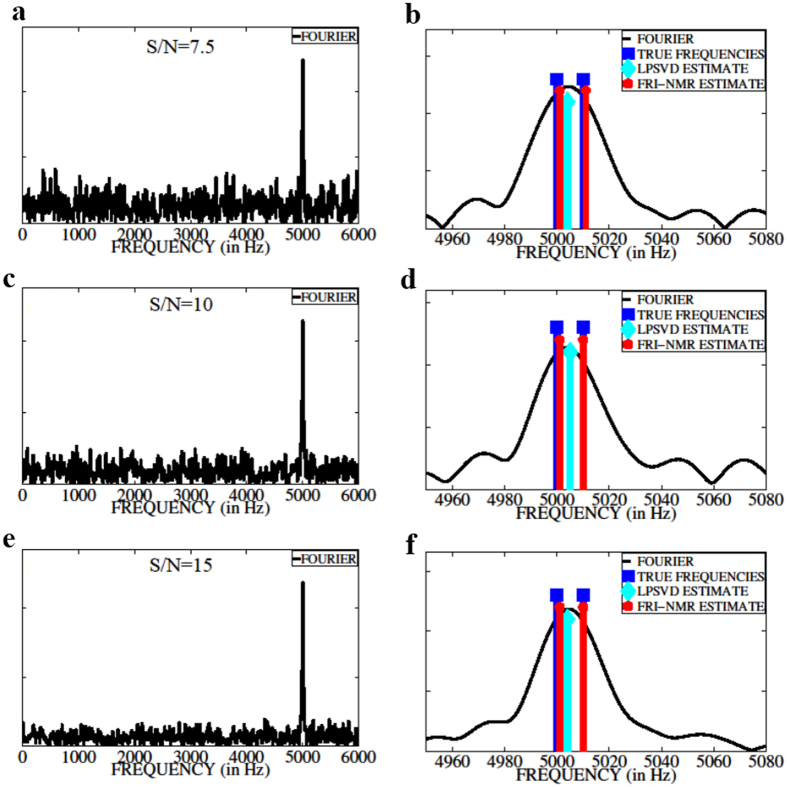
Figure 1.
A comparison of frequency-resolution capability of different methods. (a), (c), and (e) show the Fourier-transformed magnitude spectra of 600 noisy FID samples consisting of two frequencies separated by ΔF = 10 Hz and sampled at 12 kHz for S/N = 7.5; 10; 15, respectively. Figs (b), (d), and (f) show the corresponding zoomed-in plots together with the true frequencies (in blue), FRI-NMR estimates (in red), and LPSVD estimates (in cyan). FRI-NMR is able to resolve frequencies that are below the resolution limit (20 Hz) of the Fourier and Linear prediction method for different S/N levels.

