Figure 3.
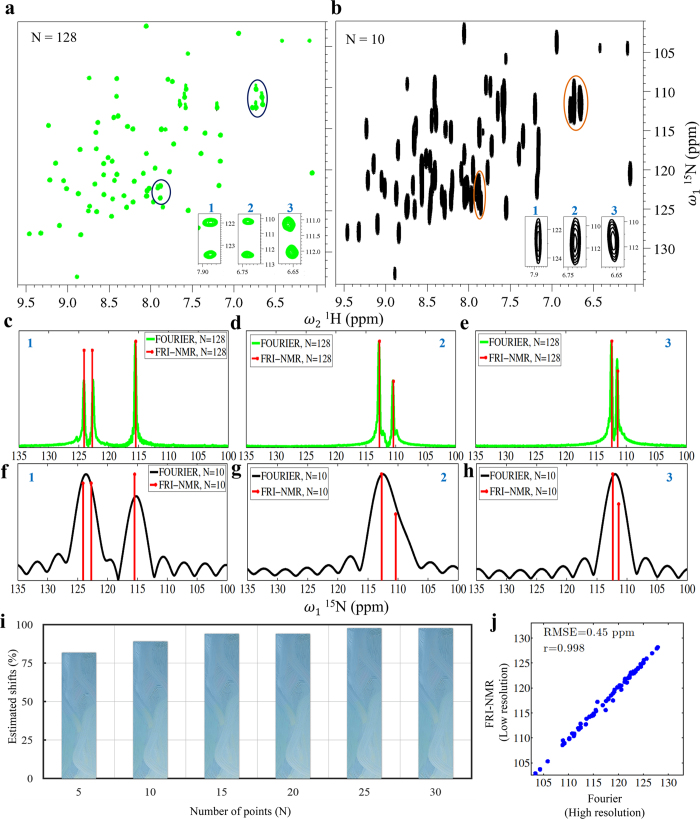
Resolving capability of FRI-NMR for proteins. (a) The 2D [15N-1H] HSQC spectrum of Ubiquitin acquired with 128 complex points along the indirect dimension (indicated as N = 128). (b) A low-resolution spectrum obtained from (a) by considering the first 10 points in the FID along the 15N dimension (1). To illustrate the resolving capability of FRI-NMR, three regions with peaks that are not resolved in (b) (shown magnified at bottom-right) were chosen. For each of these three regions, the underlying overlapping frequencies along ω1 were estimated using FRI-NMR as shown in (c–h). In (c–e) the FRI-NMR estimates (red lines) are shown superimposed on the high-resolution 1D traces obtained from (a). In (f–h) the same frequencies are estimated by FRI-NMR from FID containing 10 points and are shown superimposed on the corresponding Fourier-transformed spectrum. (i) The percentage of peaks in Ubiquitin that was estimated by FRI-NMR using the first N points in the FID (N = 5 to 30). (j) The high correlation obtained between the chemical shift values estimated by FRI-NMR from the 10-point FID and the high-resolution 128-point FID. The corresponding RMSE value between the two sets is also indicated.

