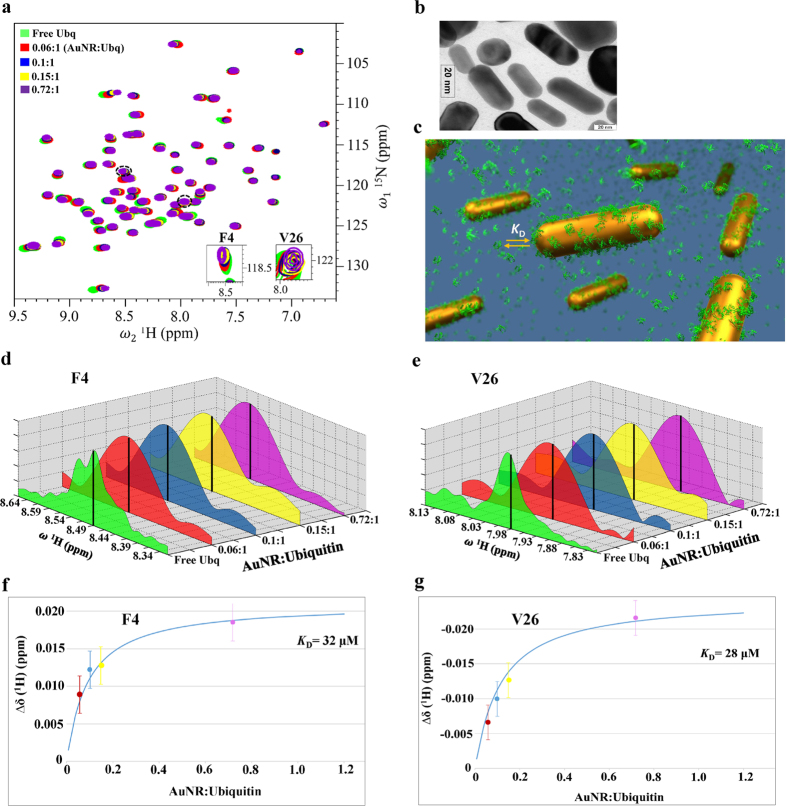
Figure 5.
Application of FRI-NMR to study Ubiquitin-Gold nanorod interactions. (a) Overlay of the 2D [15N-1H] HSQC spectra of Ubiquitin acquired at different gold nanorod (AuNR) to protein concentration ratios; (b) A transmission electron microscopy (TEM) image indicating the dimensions of nanorods; (c) A schematic illustration of the protein-gold nanorod interaction depicting the adsorption of the protein on the nanorod surface and the exchange of the adsorbed protein molecules with those in the bulk with a dissociation constant (K D); (d) and (e) are the 1D traces along 1H (ω2) for the two residues (F4 and V26) shown magnified in (a) at different protein additions. The black vertical lines indicate the FRI-NMR estimates of chemical shifts. The high-resolution spectrum of free Ubiquitin is shown; (f), (g) are the corresponding plots of the change in the 1H chemical shift with respect to free Ubiquitin for different additions of the protein estimated using the FRI-NMR method. The continuous blue line corresponds to the fit of the equation used for determining the indicated K D values (see Section S4 of Supporting Information).

